November Market Update

Our team is committed to continuing to serve all your real estate needs while incorporating safety protocol to protect all of our loved ones.
In addition, as your local real estate experts, we feel it’s our duty to give you, our valued client, all the information you need to better understand our local real estate market. Whether you’re buying or selling, we want to make sure you have the best, most pertinent information, so we’ve put together this monthly analysis breaking down specifics about the market.
As we all navigate this together, please don’t hesitate to reach out to us with any questions or concerns. We’re here to support you.
- Yvette Teng, LIC #02044946
The Big Story
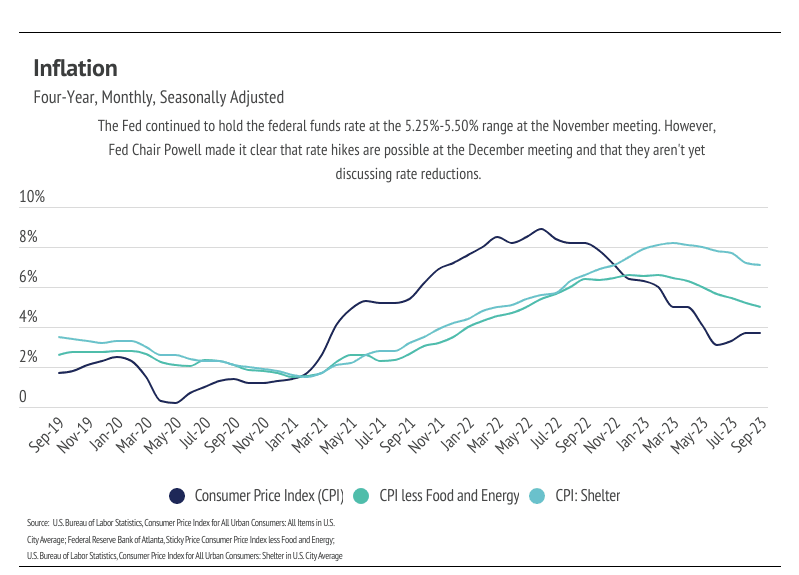
Fed policy is working, but mostly just on housing
Quick Take:
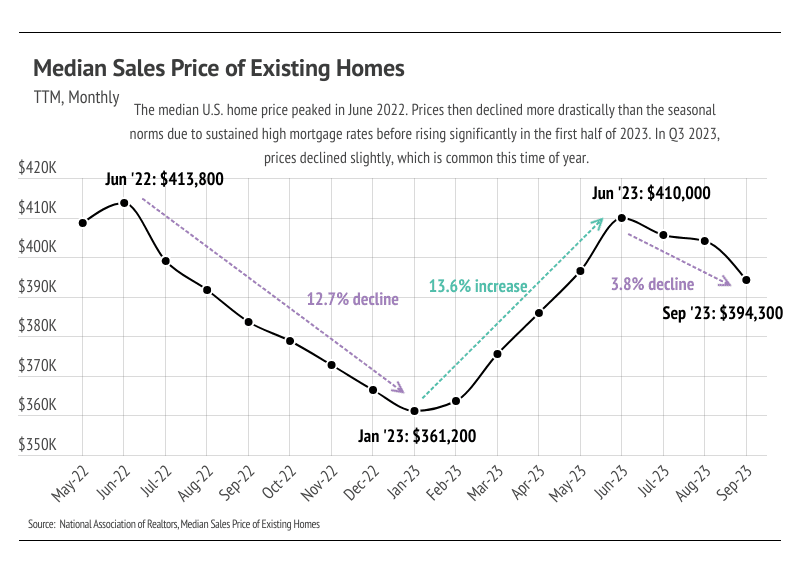
• The national median home price declined 3.8% in the third quarter, landing only 4.7% below the all-time high reached in June 2022 and reflecting typical seasonal trends. Prices didn’t contract significantly in Q3 2023 despite mortgage rates rising 0.6%.
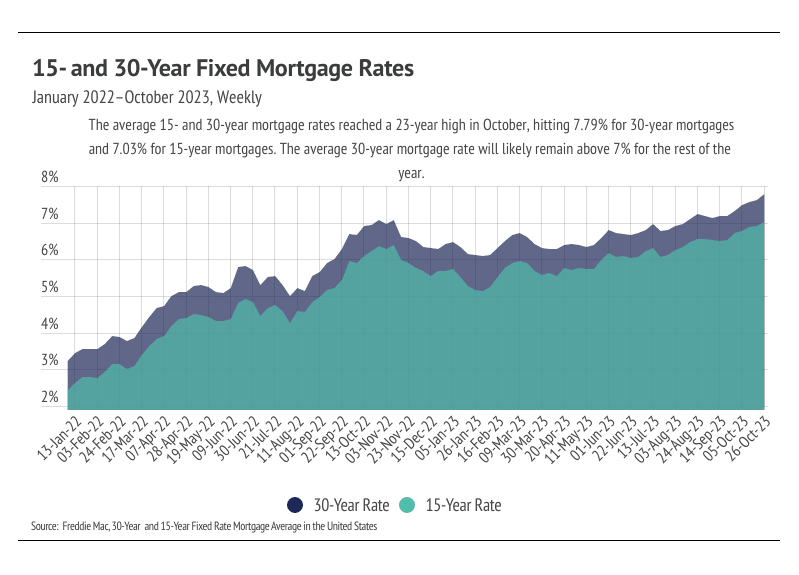
• In October, the average 30-year mortgage rate reached its highest level since October 2020 at 7.79%. Higher and higher rates continue to price potential buyers out of the market and prevent sellers who are locked into hyper-low rates from entering the market.
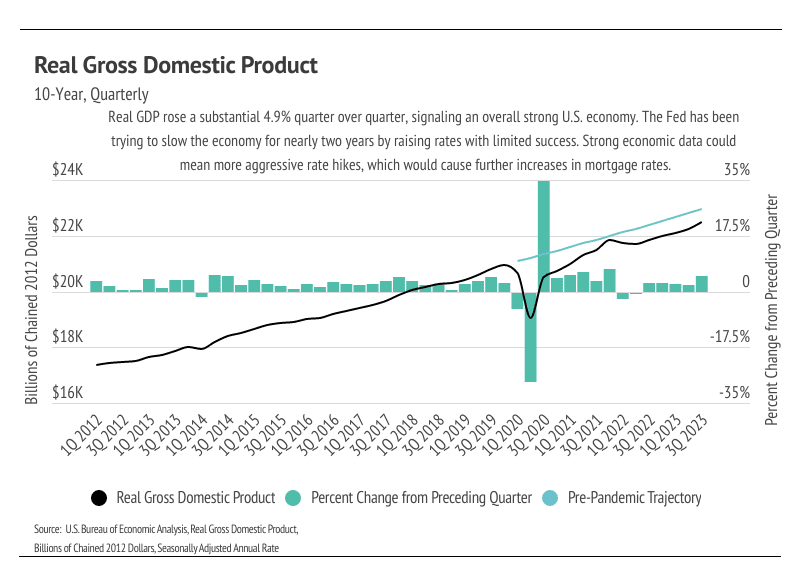
• The Q3 Real Gross Domestic Product (inflation-adjusted GDP) rose 4.9% quarter over quarter, indicating a broadly strong economy. Although unemployment rose 0.3% to 3.9%, the jobs market remains robust. Inflation, which rose in Q3, is nearly double the Fed’s target rate of 2%, so rate reductions won’t happen in the near future.
Note: You can find the charts & graphs for the Big Story at the end of the following section.
_____________________________________________________________________________________________
It’s all about interest rates
Home prices remain near all-time highs, largely due to the sustained low inventory levels, and despite the average 30-year mortgage rate hitting a 23-year high in October at 7.79%. It’s hard to overstate the full significance of higher mortgage rates on the housing market; but, in short, they are the primary driver of market slowdown. For example, when accounting for the cost of financing a mortgage, a buyer’s monthly cost for a median home today is actually 11% higher than in June 2022 when prices were at their peak. Looking further back to when the Fed began to raise rates at the beginning of 2022, the median monthly cost of a home has increased 76% from then until now.
So why have prices stayed elevated even as the cost of financing has skyrocketed over the past 22 months? For sellers, prices have to stay high or else they wouldn’t enter the market. Approximately 75% of U.S. homeowners have mortgage rates of less than 4%, according to JPMorgan, which has kept sellers from entering the market. If prices broadly contracted, even fewer sellers would come to market because they likely couldn’t afford a new house because their profit margin would be too low. Although people move for all sorts of reasons, generally speaking, there are very few sellers who are selling because they have no choice. Even if sellers were breaking even on their home sale, transitioning from a sub 4% mortgage to a nearly 8% rate is completely unappealing. Sellers who are coming to market now need to make a profit so that they can finance less of their next home in order to counteract the higher mortgage rate. Of course, this is for existing homes, but new construction isn’t much different. Material and financing costs are higher for homebuilders, too, and when a house costs more to build, the prices increase as well.
Inflation isn’t helping the market, either. People feel less wealthy than they did three years ago, and they’re right to feel that way. In just the three years from September 2020 to September 2023, the dollar has lost about 15% of its buying power, the same amount it lost over the preceding 10 years (September 2010 to September 2020). Even though inflation is declining, all that means is that prices are rising more slowly than last year — which is good, but it doesn't make anything more affordable. The combination of declining purchasing power and higher mortgage rates only reduces market participants, slowing the market.
Inflation isn’t helping the market, either. People feel less wealthy than they did three years ago, and they’re right to feel that way. In just the three years from September 2020 to September 2023, the dollar has lost about 15% of its buying power, the same amount it lost over the preceding 10 years (September 2010 to September 2020). Even though inflation is declining, all that means is that prices are rising more slowly than last year — which is good, but it doesn't make anything more affordable. The combination of declining purchasing power and higher mortgage rates only reduces market participants, slowing the market.
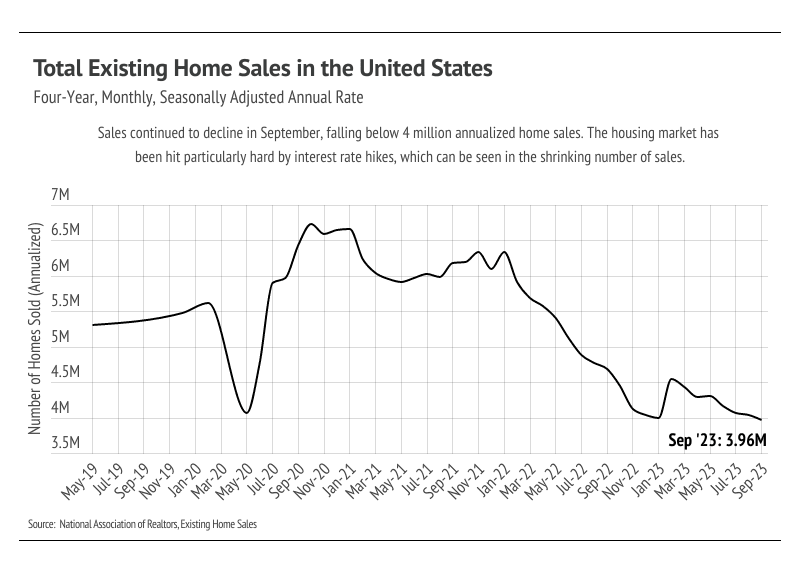
High mortgage rates aren’t going away anytime soon because inflation is still about twice as high as the Fed would like. So far, most of the economic slowing the Fed intended by raising rates seems to be isolated to the housing market. The National Association of Realtors (NAR) reported that the number of homes sold dropped 2.0% month over month and 15.4% year over year to the lowest number of sales in the four years that NAR reports. Real GDP rose significantly in Q3 2023, indicating strong U.S. economic growth rather than economic slowdown. It’s unlikely that the Fed will hike rates at the December meeting, and very unlikely that they will reduce rates in the near future. We can expect mortgage rates between 7% and 8% in 2024, which will continue to slow the market.
Different regions and individual houses vary from the broad national trends, so we’ve included a Local Lowdown below to provide you with in-depth coverage for your area. In general, higher-priced regions (the West and Northeast) have been hit harder by mortgage rate hikes than less expensive markets (the South and Midwest) because of the absolute dollar cost of the rate hikes and limited ability to build new homes. As always, we will continue to monitor the housing and economic markets to best guide you in buying or selling your home.
_____________________________________________________________________________________________
Big Story Data
_____________________________________________________________________________________________
The Local Lowdown
Quick Take:
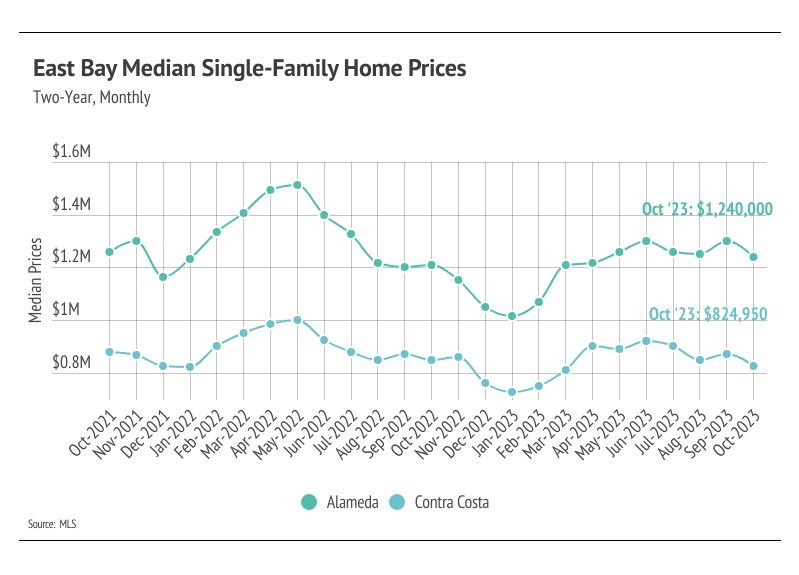
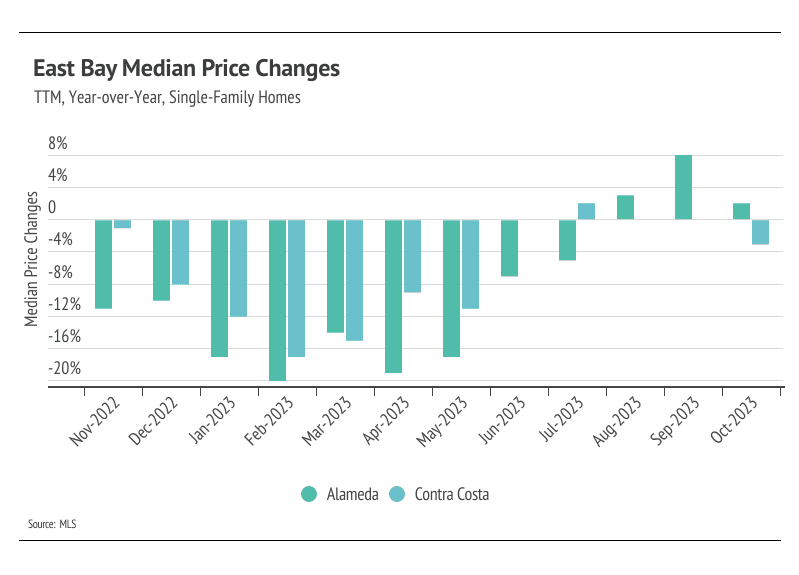
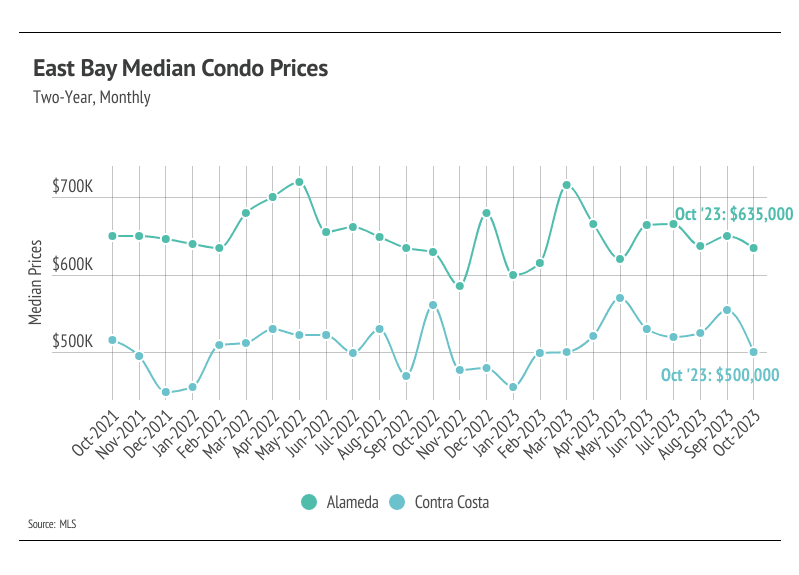
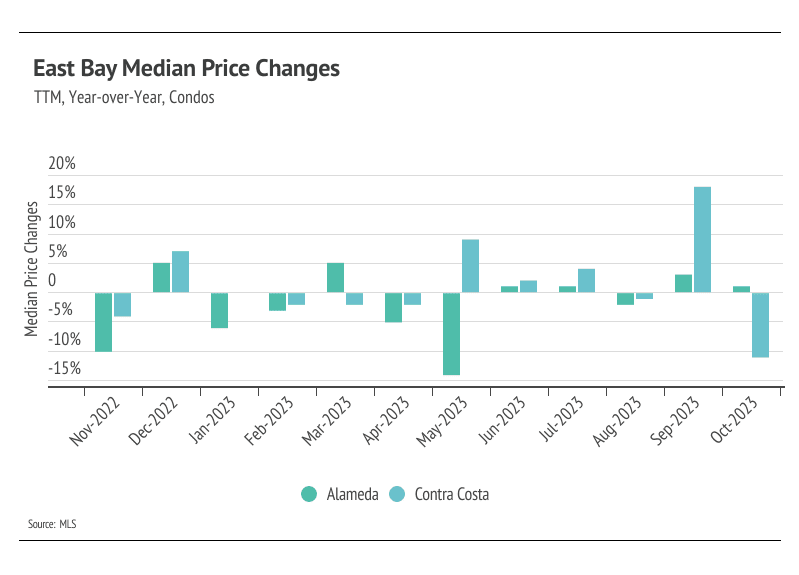
• The median single-family home and condo prices declined in the East Bay month over month. Year over year, prices in Alameda increased 2% for single-family homes and 1% for condos, while single-family home and condo prices in Contra Costa declined 3% and 11%, respectively.
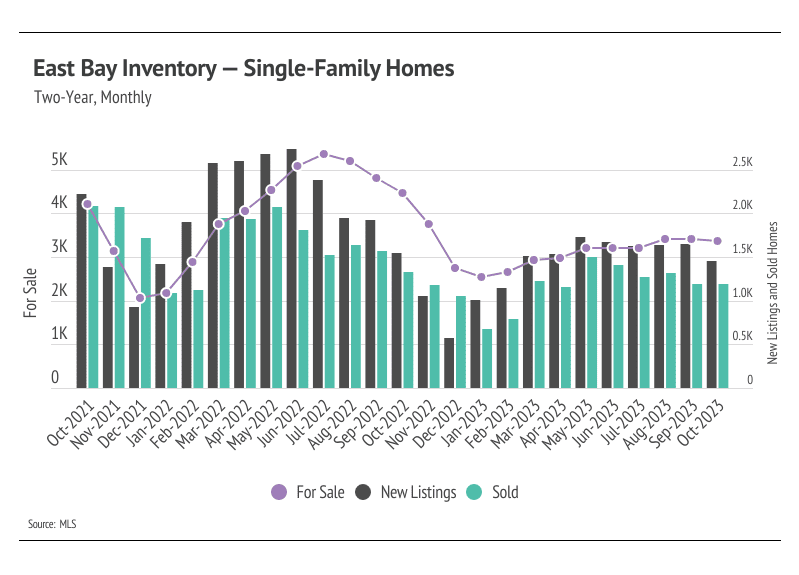
• Active listings declined slightly from September to October, breaking an eight-month upward trend. Year over year, inventory is down 20%, highlighting one of the challenges of buying a home in a desirable market.
• Months of Supply Inventory indicates the market is slowly shifting toward balance, but it is still a sellers’ market. It’s common for the market to trend toward balance in the fall and winter, when fewer buyers are in the market and sales slow.
Note: You can find the charts/graphs for the Local Lowdown at the end of this section.
_____________________________________________________________________________________________
Prices remain near record highs
In the East Bay, home prices haven’t been largely affected by rising mortgage rates. Increasing demand and low, but rising inventory helped drive the rapid home price appreciation that the East Bay experienced in the first half of the year. Single-family home and condo prices contracted over the past four months. Year to date, prices have risen significantly across the East Bay counties with the exception of Alameda condo prices, which are down slightly. Notably, single-family home prices rose 17% in Alameda and 7% in Contra Costa this year. In the fourth quarter, we expect prices to remain fairly stable, but slight price contractions are normal this time of year.
Typically, demand begins to decline in the fall and bottoms out in January, so the consistently low supply should be less of an issue. With mortgage rates at a 23-year high, buyers have more incentive to compete over the most desirable homes. Because of the cost of financing, homebuyers aren’t settling for less than the best home they can find.
_____________________________________________________________________________________________
Single-family home sales rose in October
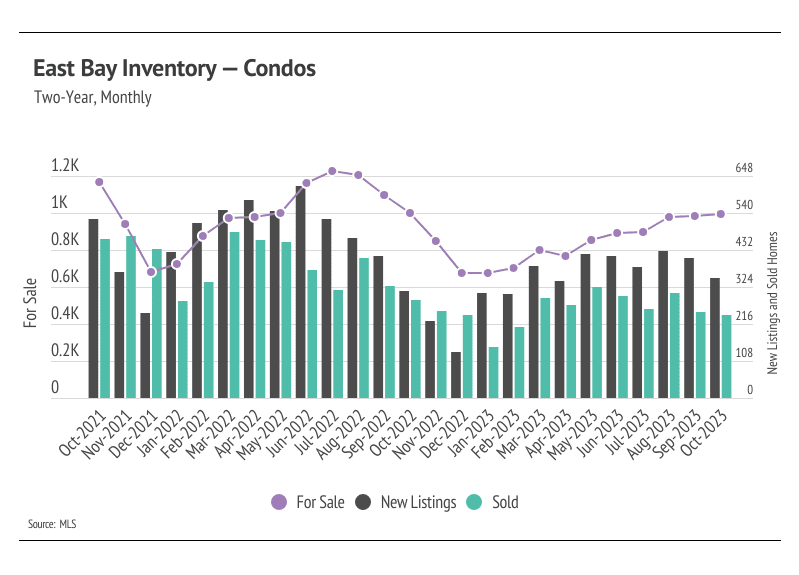
Single-family home and condo inventory barely increased at all this year, which is far from the seasonal norm. Typically, inventory peaks in July or August and declines through December or January. However, in 2023, new listings were so depressed that inventory remained fairly flat for single-family homes. Despite a lack of inventory, sales increased from September to October, highlighting demand in the area. Even though inventory increased some this year, it’s still historically low, moving higher primarily due to softening demand (fewer sales) caused by higher interest rates and normal seasonality. The number of new listings coming to market is a significant predictor of sales. Year over year, sales and new listings are down 10% and 3%, respectively.
As demand slows, buyers are gaining more negotiating power and paying slightly less than they were four months ago. In June 2023, the average seller received 105% of list price compared to 103% of list in October. That being said, inventory will almost certainly remain historically low for the rest of the year, and will likely remain low in 2024, which will create price support.
_____________________________________________________________________________________________
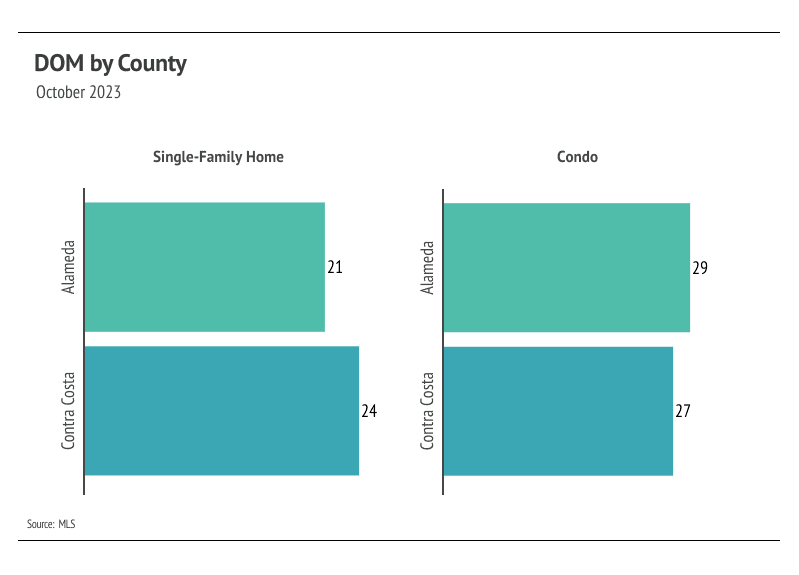
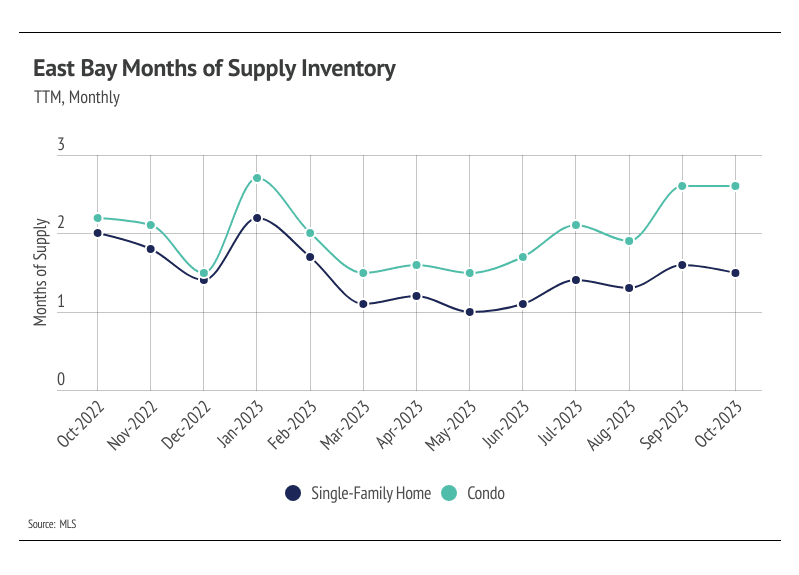
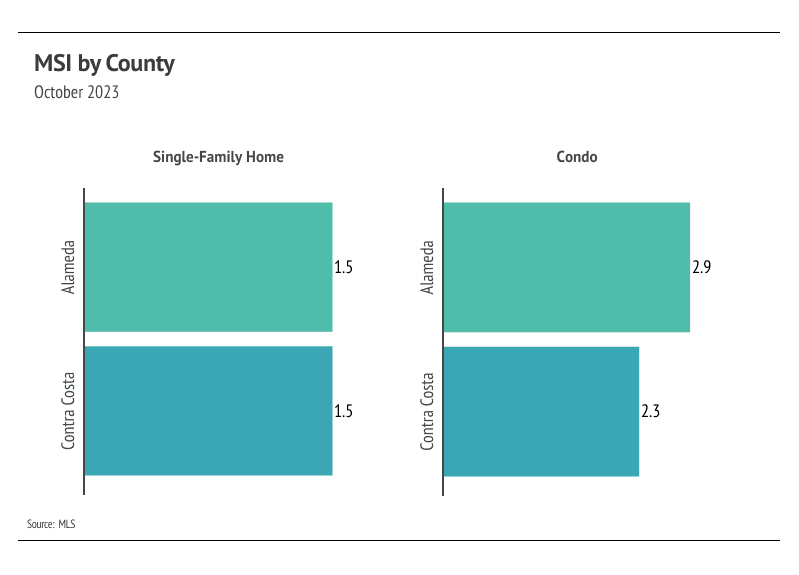
Months of Supply Inventory indicates the market is trending toward balance, but it is still a sellers’ market
Months of Supply Inventory (MSI) quantifies the supply/demand relationship by measuring how many months it would take for all current homes listed on the market to sell at the current rate of sales. The long-term average MSI is around three months in California, which indicates a balanced market. An MSI lower than three indicates that there are more buyers than sellers on the market (meaning it’s a sellers’ market), while a higher MSI indicates there are more sellers than buyers (meaning it’s a buyers’ market). The East Bay market tends to favor sellers, which is reflected in its low MSI. MSI fell sharply in the first quarter this year before gently trending higher starting in May. In October, MSI remained below three months of supply, indicating the market still favors sellers.
_____________________________________________________________________________________________
Local Lowdown Data

Thinking of buying or selling? Contact me today!
Stay up to date on the latest real estate trends.

March 21, 2026

March 5, 2026
February 28, 2026

January 16, 2026

December 30, 2025

December 4, 2025

November 19, 2025

October 21, 2025

September 24, 2025
You've got questions and we can't wait to answer them.