September Market Update

Our team is committed to continuing to serve all your real estate needs while incorporating safety protocol to protect all of our loved ones.
In addition, as your local real estate experts, we feel it’s our duty to give you, our valued client, all the information you need to better understand our local real estate market. Whether you’re buying or selling, we want to make sure you have the best, most pertinent information, so we’ve put together this monthly analysis breaking down specifics about the market.
As we all navigate this together, please don’t hesitate to reach out to us with any questions or concerns. We’re here to support you.
- Yvette Teng, LIC #02044946
_____________________________________________________________________________________________
The Big Story
Quick Take:
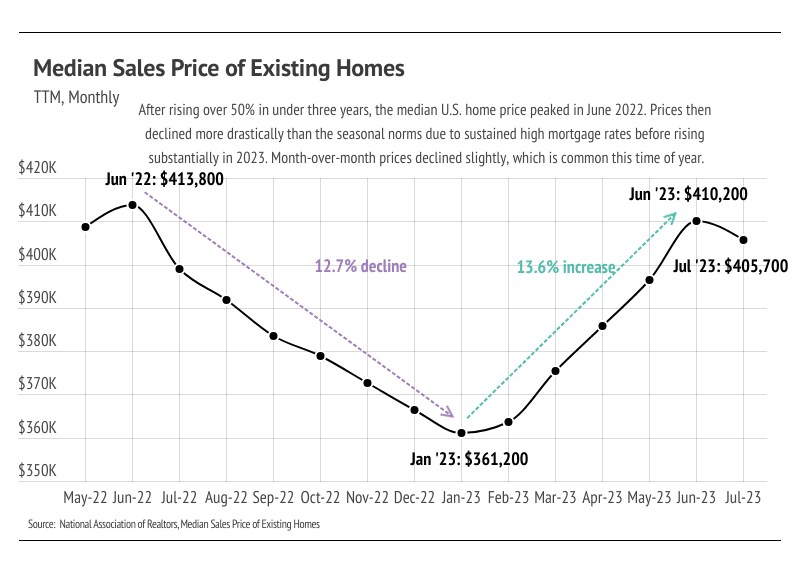
• Home prices fell for the first time this year, declining 1.05% month over month, aligning with seasonal norms where prices rise in the first half of the year and contract in the second half of the year.
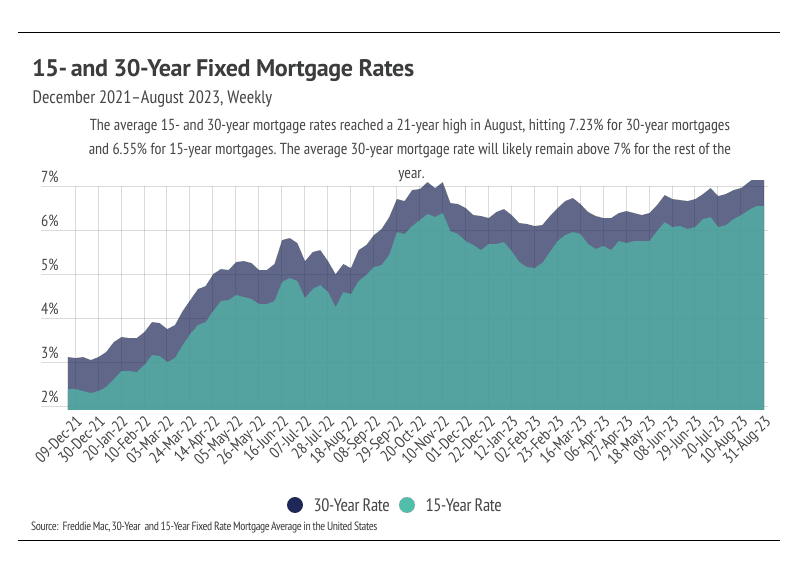
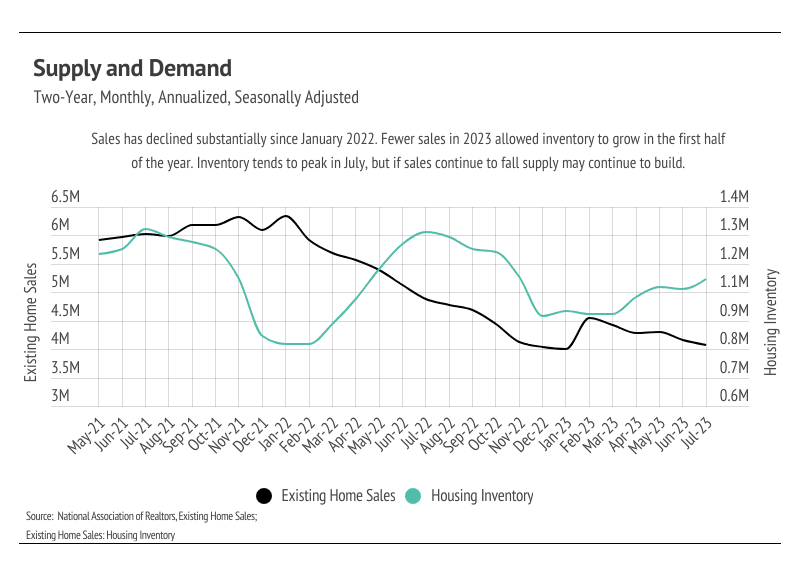
• In August, the average 30-year-mortgage rate reached the highest level since June 2021 at 7.23%, largely contributing to the lack of new inventory and low number of sales. The number of home sales continued to slow for the fifth month in a row.
• Although the housing market still favors sellers, it’s trending more meaningfully toward balance, as demand slows and inventory starts to rebuild.
Note: You can find the charts & graphs for the Big Story at the end of the following section.
_____________________________________________________________________________________________
Home prices decline for the first month this year
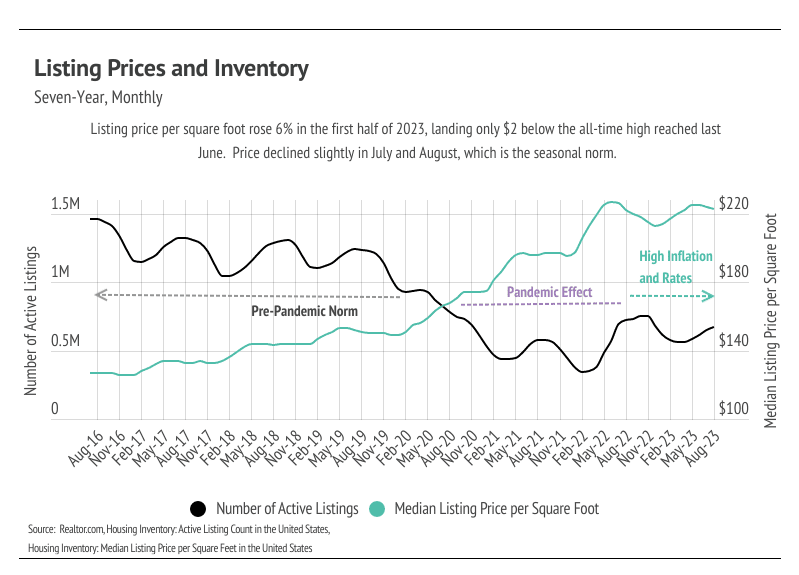
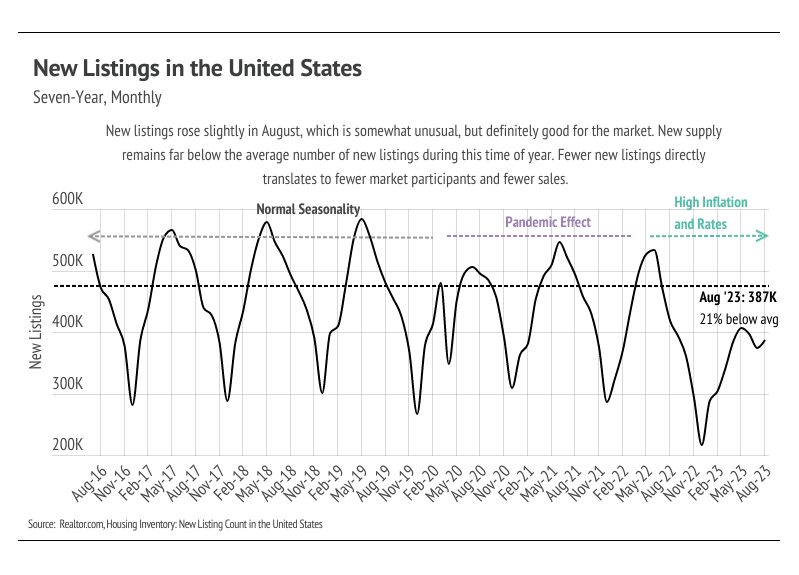
The average 30-year-mortgage rate hit a 22-year high in August. Higher mortgage rates, which negatively affect affordability, combined with the annual summer sales slowdown and higher inventory have caused prices to decline month over month from the 2023 price peak in June. The National Association of Realtors (NAR) data show that the median home sale price in the United States declined by 1%, and Realtor.com data indicate that the median list price per square foot also decreased 1%. These aren’t major declines, as you can see, especially when considering the decline in sales. According to NAR, the number of homes sold dropped 2.2% month over month and 16.6% year over year, which is substantial but not necessarily unexpected. Home sales in 2020 and 2021 were the highest since the 2006 housing bubble burst, and normal seasonal trends were less pronounced or non-existent. It’s very easy to get wrapped up in the recent past, especially when it comes to large financial purchases, most of which are life-changing. We weren’t sure how long the break in historic seasonality would last, but it seems to have ended, and seasonality has mostly returned.
With historic seasonal trends, home prices and inventory increased in the first half of the year and declined in the back half. The pattern is essentially two steps forward and one step back over and over, so even when the second half of the year sees some price decline, year-over-year prices tend to be higher. In June 2023, the median price landed 0.9% below the all-time high reached in June 2022, revealing that prices can bounce back quickly and, maybe more impressively, can appreciate during a period of high mortgage rates.
This year, inventory may peak later than usual if sales continue to decline through what are often the strongest sales months (May-August). Inventory has steadily increased since March but is still historically low. Similar to sales, inventory is down 14.6% year over year. However, year to date, inventory has increased 15.6%, whereas sales has only increased 1.0%. Inventory growth tends to slow in the second half of the year, which is what we expect during the remainder of 2023. Far fewer new listings have come to market than a typical year, so inventory growth has been driven by fewer sales. Since sales commonly decline in the back half of the year, especially once we hit the holiday season, 2023 may have the fewest homes sold in modern history. The drop in sales and increase in inventory has caused the market to trend toward balance, although we are still in a sellers’ market. The white-hot market from 2020 to 2022 created the market we see today, which is neither hot nor cold, but rather stuck in a space of low supply and softening demand. We might simply say the market is slow.
Different regions and individual houses vary from the broad national trends, so we’ve included a Local Lowdown below to provide you with in-depth coverage for your area. In general, higher-priced regions (the West and Northeast) have been hit harder by mortgage rate hikes than less expensive markets (the South and Midwest) because of the absolute dollar cost of the rate hikes and limited ability to build new homes. As always, we will continue to monitor the housing and economic markets to best guide you in buying or selling your home.
_____________________________________________________________________________________________
Big Story Data
_____________________________________________________________________________________________
The Local Lowdown
Quick Take:
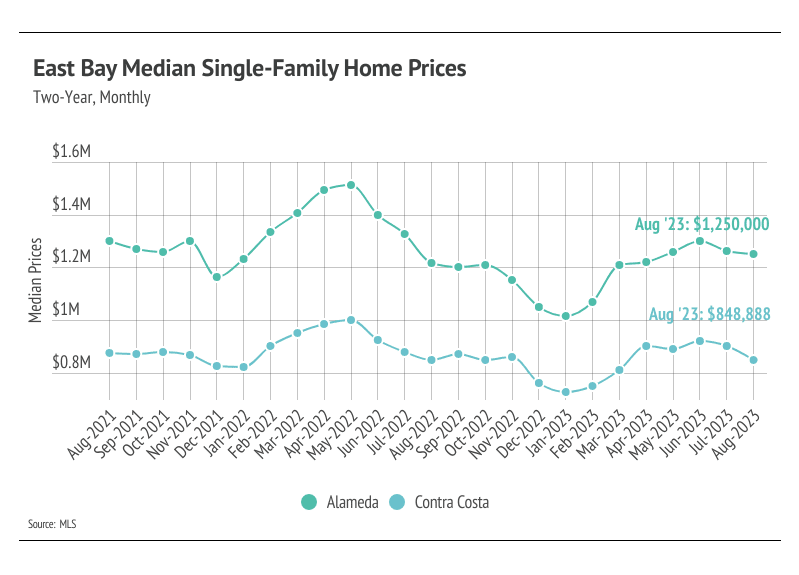
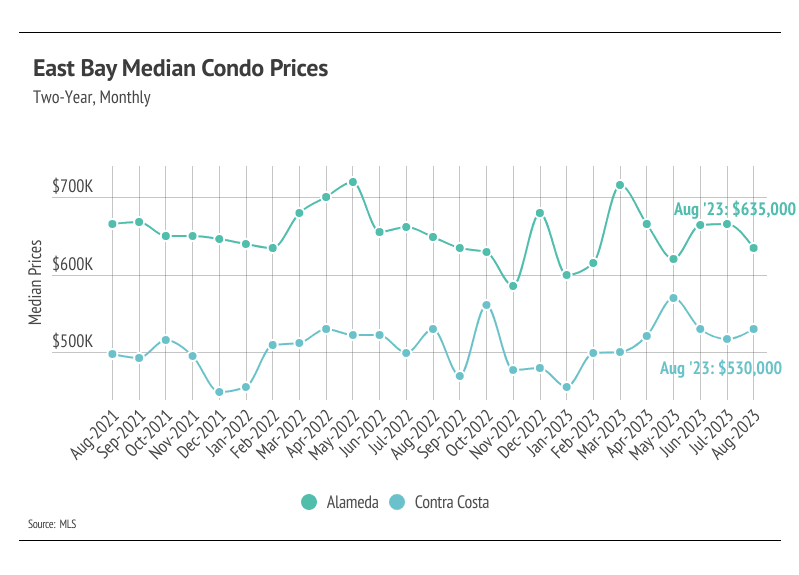
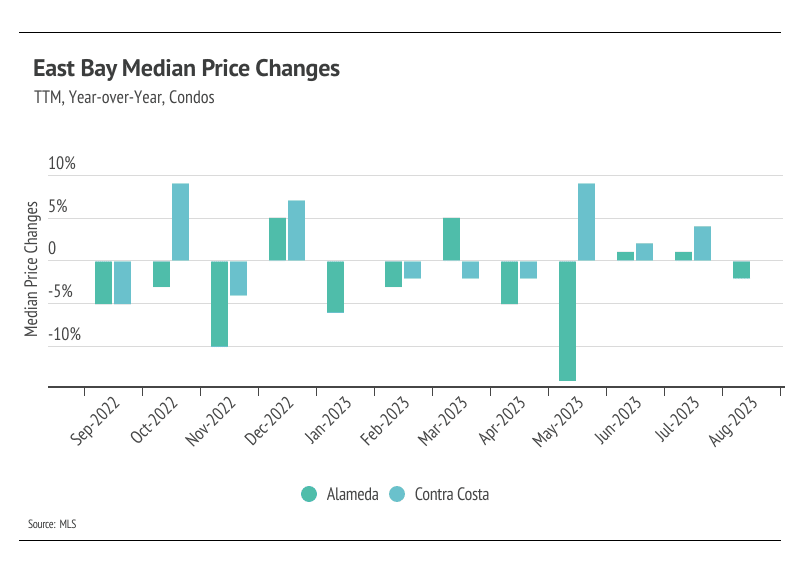
• Since January 2023, single-family home prices rose 28% in Alameda and 21% in Contra Costa. Similarly, condo prices rose 8% and 21%, respectively.
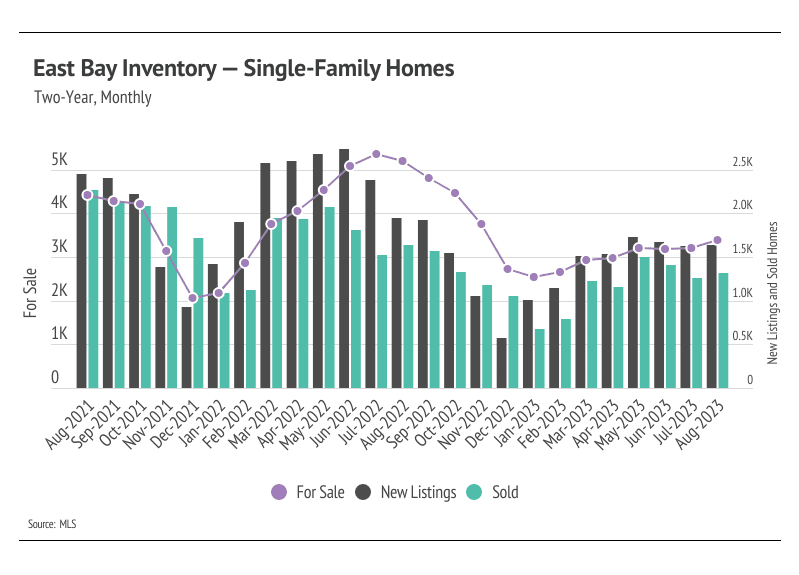
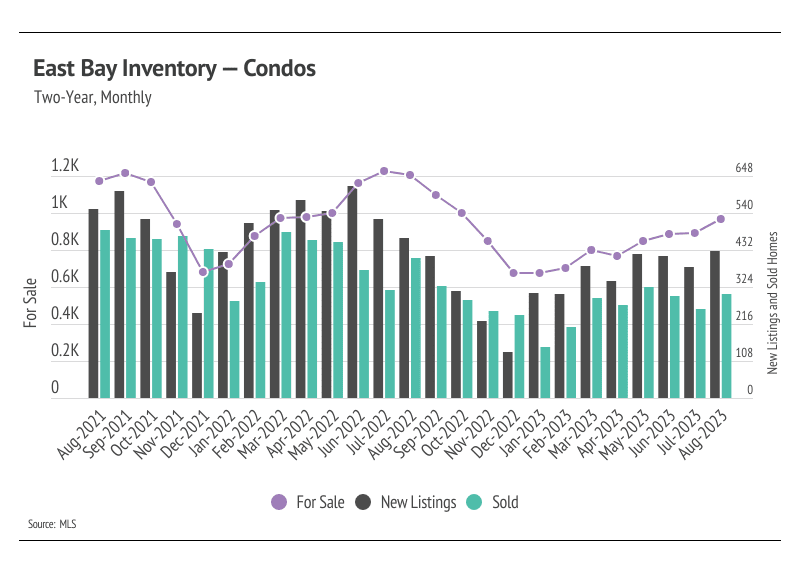
• Sales, new listings, and inventory all rose from July to August, but is likely the last push of the summer buying season. Inventory remains depressed but has still grown significantly in 2023, which has helped alleviate some excess demand.
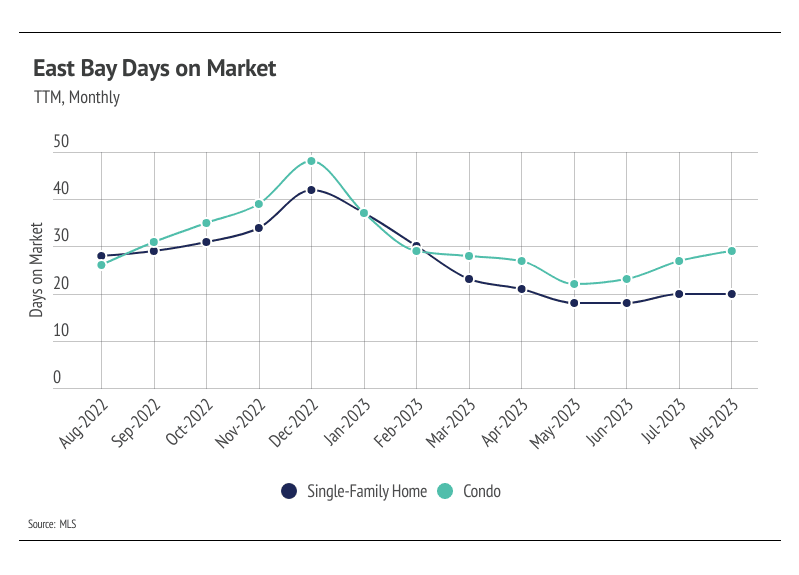
• Months of Supply Inventory has risen slightly over the summer, but remains a sellers’ market. Homes are still selling quickly, and sellers are receiving a greater percentage of asking price, all of which highlight a competitive environment for buyers.
Note: You can find the charts/graphs for the Local Lowdown at the end of this section.
_____________________________________________________________________________________________
Prices slightly contract — the seasonal norm
In the East Bay, the housing market is always experiencing high demand, especially in the spring and early summer months. Increasing demand and low, but rising inventory helped drive the rapid home price appreciation that the East Bay experienced in the first half of the year. Typically, demand begins to decline in July and August, so the consistently low supply may become less of an issue. However, less of an issue doesn’t mean a non-issue. Quality new listings will certainly be sold quickly, while less desirable homes will sit on the market. This isn’t unusual, but it’s more apparent due to current mortgage rates. Potential homebuyers aren’t nearly as willing to pay a premium for a fixer upper as they were in 2020 and 2021.
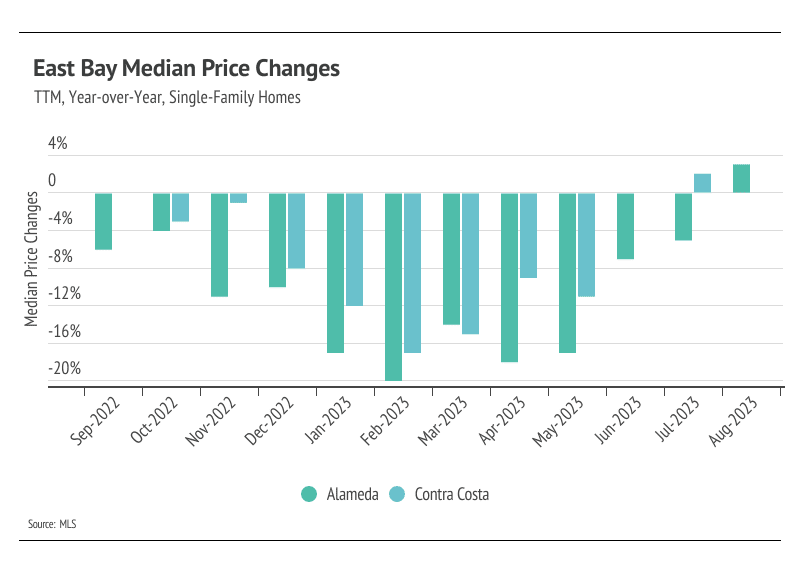
In August, the median single-family home prices were up year to date across East Bay counties. As sales and new listings slow in the second half of the year, home prices typically remain stable or decline at the margins.
_____________________________________________________________________________________________
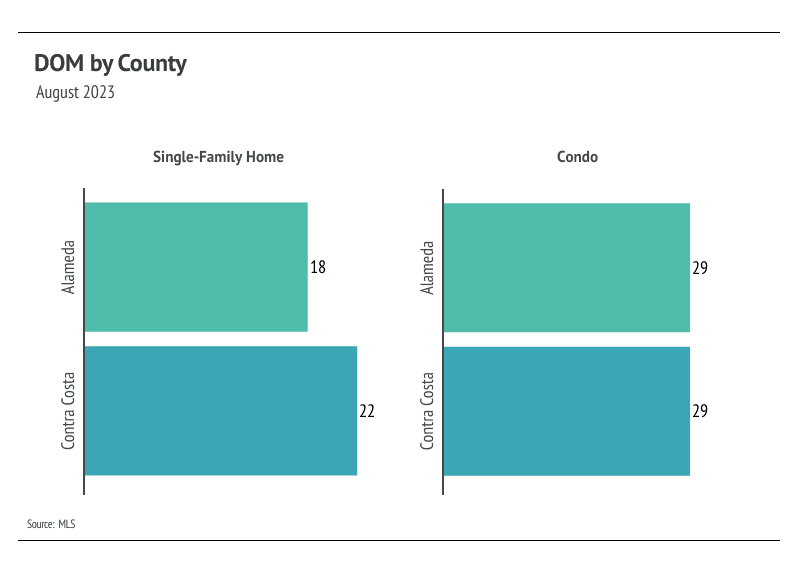
Inventory, sales, and new listings rose in August
Single-family home and condo inventory, sales, and new listings trended higher year to date, although all remain at significantly depressed levels. Typically, inventory peaks in July or August and declines through December or January. Single-family home and condo inventory reached new highs for the year in August, but we will likely see fewer transactions in the coming months if normal seasonal trends hold. Currently, inventory is so low relative to demand that any amount of new listings is good for the market. However, new listings were unusually low this year, which has directly impacted both inventory and sales. The number of home sales is, in part, a function of the number of active listings and new listings coming to market. Since new listings and sales peaked in May 2023, sales declined 12%, while new listings fell 4%.
As tight inventory levels continue, sellers have gained more negotiating power. In January 2023, the average seller received 95% of list price compared to 103% of list in August. Inventory will almost certainly remain historically low for the rest of the year and likely remain low in 2024.
_____________________________________________________________________________________________
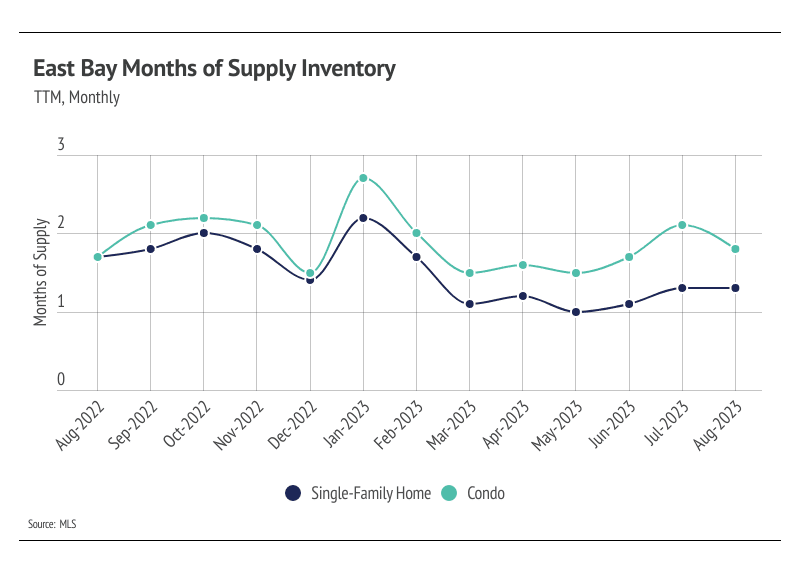
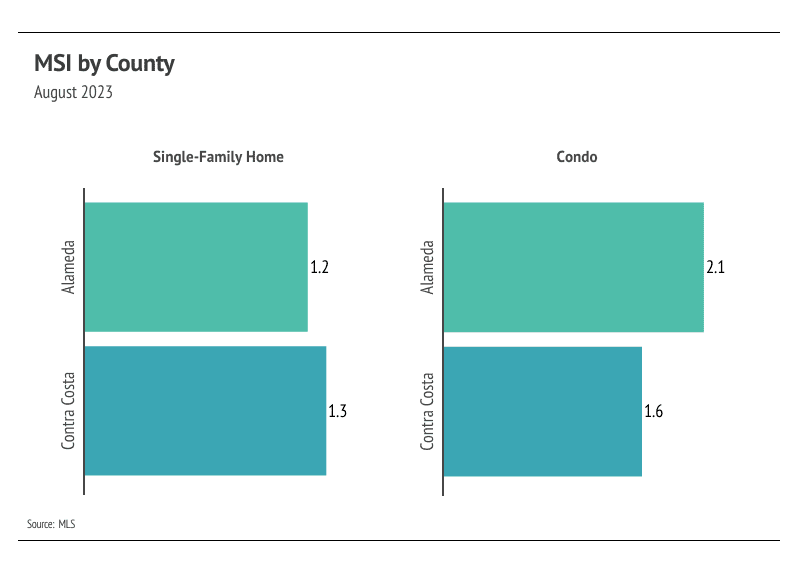
Months of Supply Inventory remained under two months in August, indicating a strong sellers’ market
Months of Supply Inventory (MSI) quantifies the supply/demand relationship by measuring how many months it would take for all current homes listed on the market to sell at the current rate of sales. The long-term average MSI is around three months in California, which indicates a balanced market. An MSI lower than three indicates that there are more buyers than sellers on the market (meaning it’s a sellers’ market), while a higher MSI indicates there are more sellers than buyers (meaning it’s a buyers’ market). The East Bay market tends to favor sellers, which is reflected in its low MSI. MSI trended lower from January to May 2023 for both single-family homes and condos. Even with the slight increase in MSI over the summer months, the market still firmly favors sellers.
_____________________________________________________________________________________________
Local Lowdown Data

Thinking of buying or selling? Contact me today!
Stay up to date on the latest real estate trends.

April 17, 2025

April 4, 2025

March 29, 2025

March 21, 2025

March 14, 2025
March 8, 2025

March 7, 2025

February 7, 2025

January 14, 2025
You've got questions and we can't wait to answer them.