February Market Update

The Bay Area housing market demonstrates remarkable strength overall, though performance varies by region
Supply dynamics show significant variation - certain areas see growing inventory while others face persistent shortages
Most regions continue to favor sellers, though specific condo markets present notable opportunities for buyers
Price stability persists broadly, with select areas experiencing modest corrections due to interest rate pressures
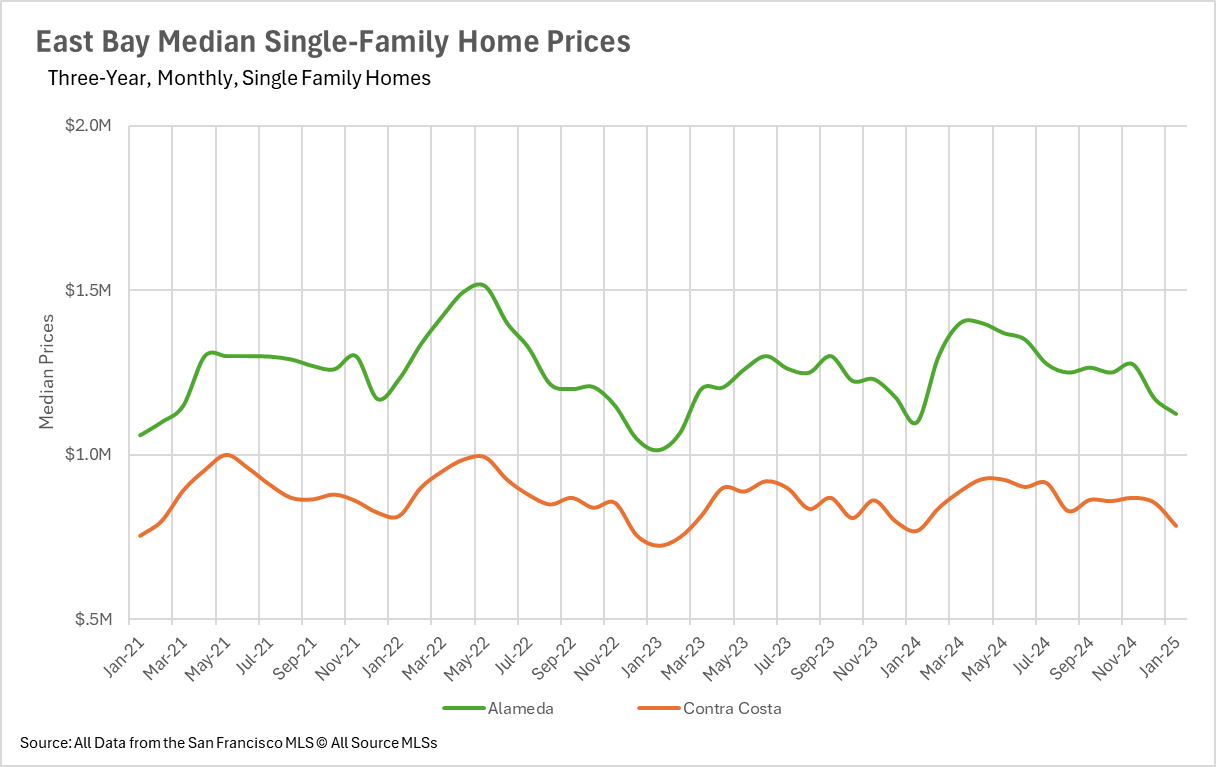
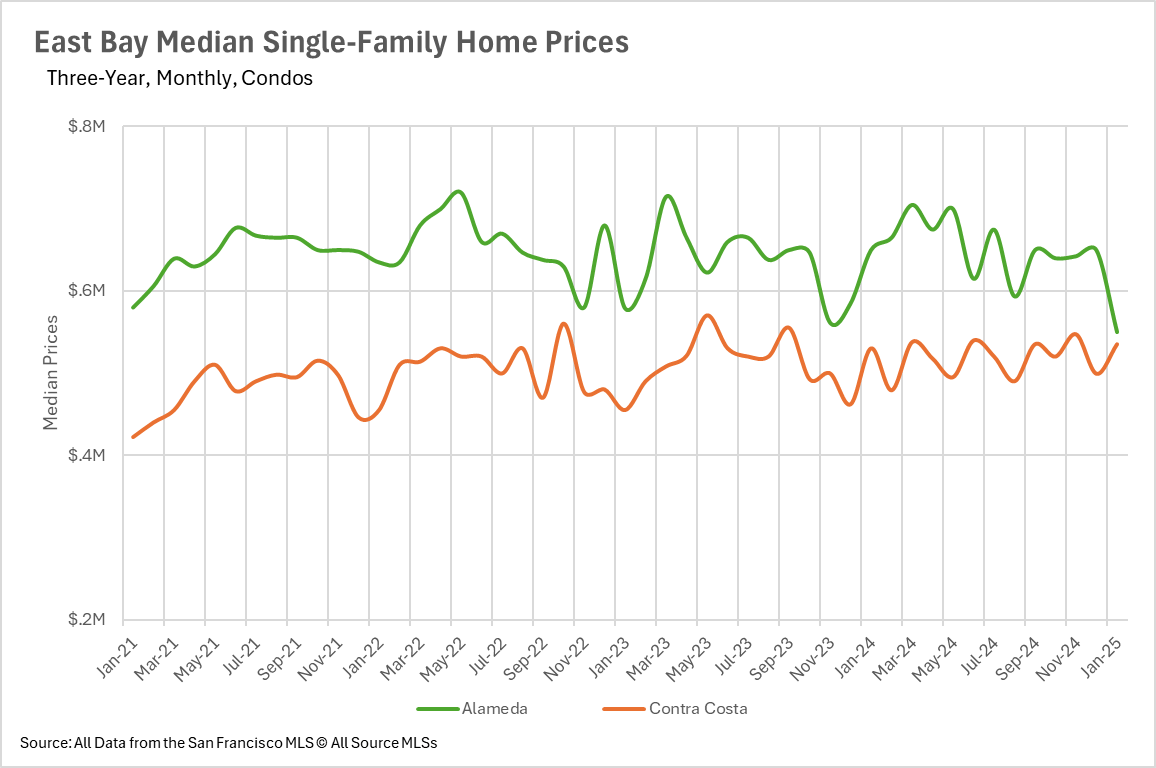
Despite broader economic headwinds and interest rate volatility, the Bay Area housing market continues to show resilience. Price performance varies significantly by county. Alameda and Contra Costa Counties recorded positive year-over-year median single-family home price increases of 2.27% and 1.95% respectively.
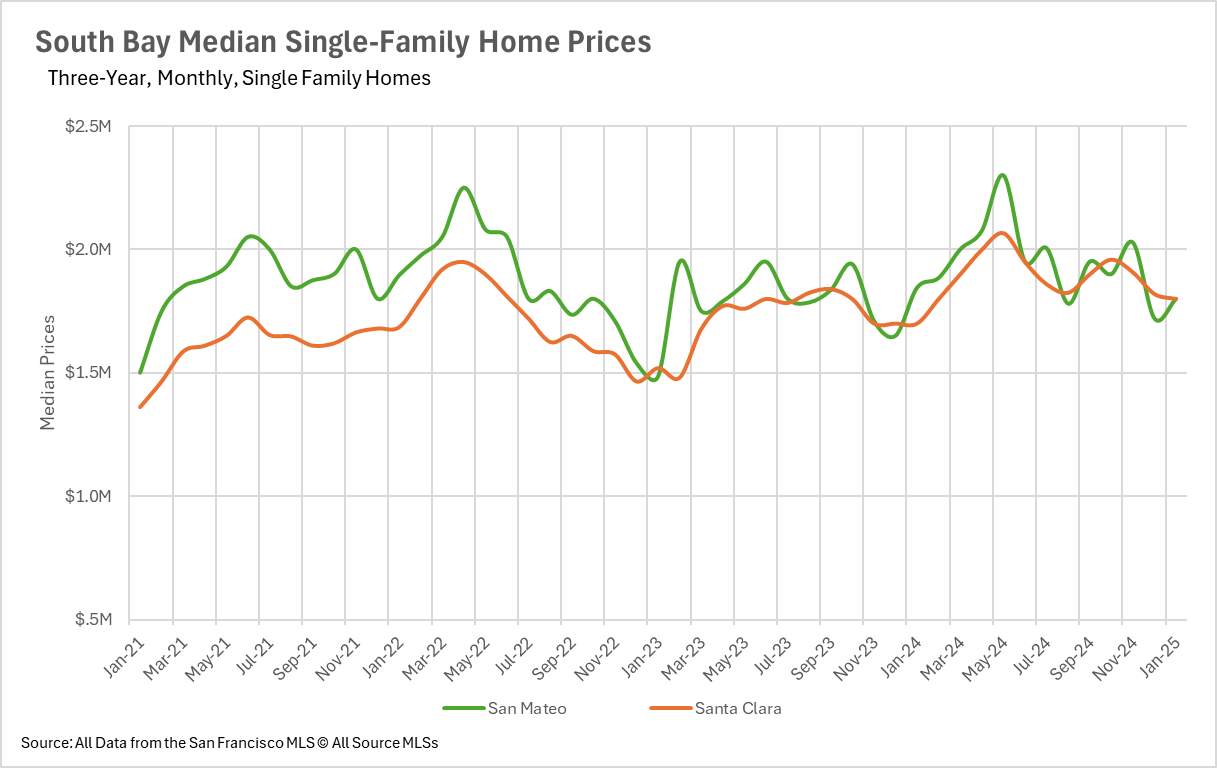
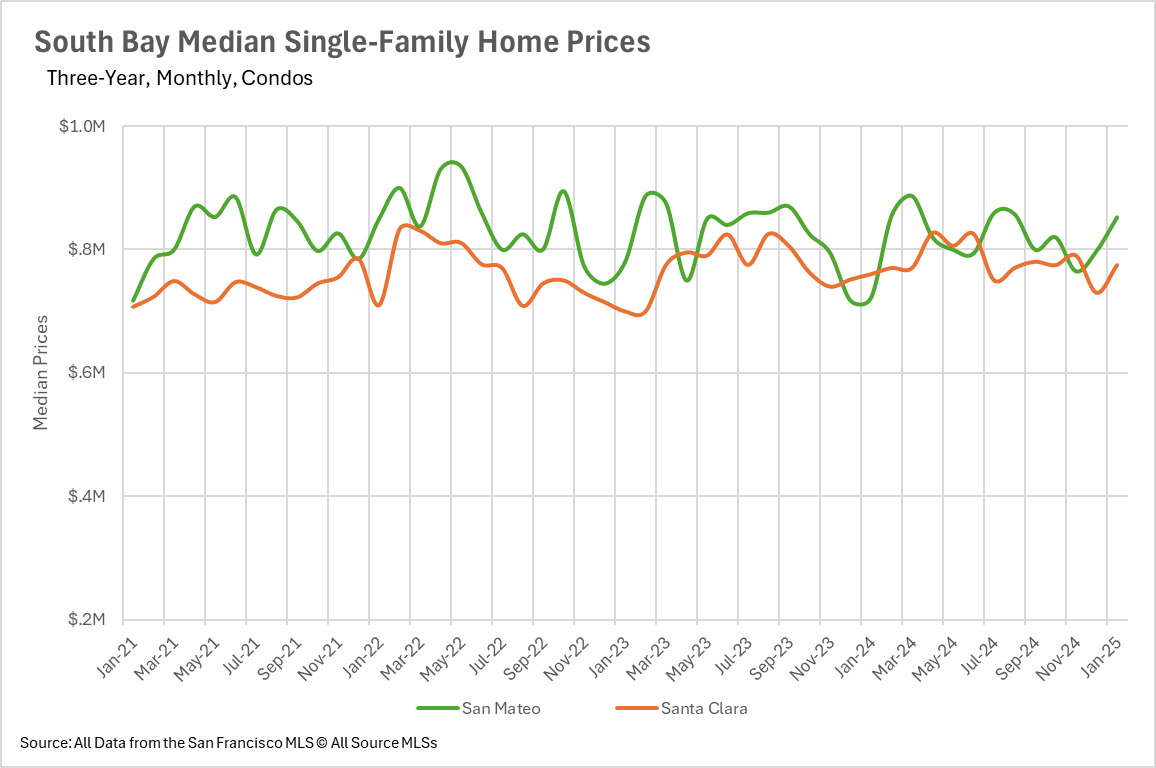
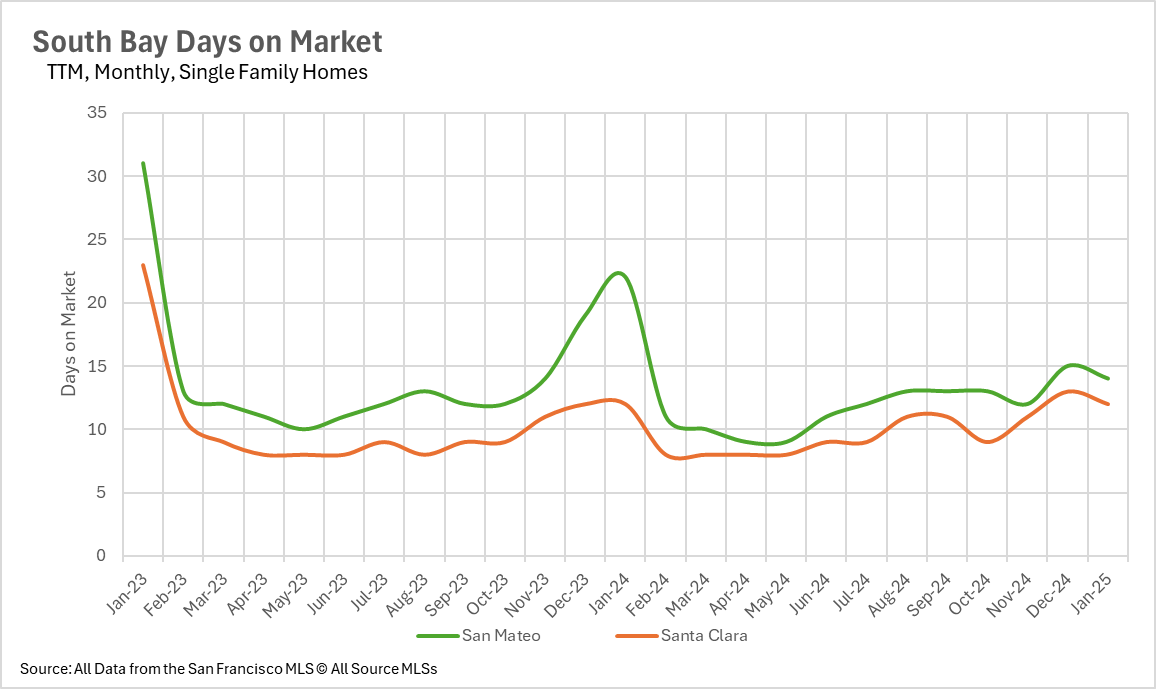
South Bay maintains its upward trajectory, with Santa Clara County posting a robust 5.88% gain and Santa Cruz County achieving a 3.36% increase in median prices. San Mateo County bucked this trend with a modest 2.44% decrease.
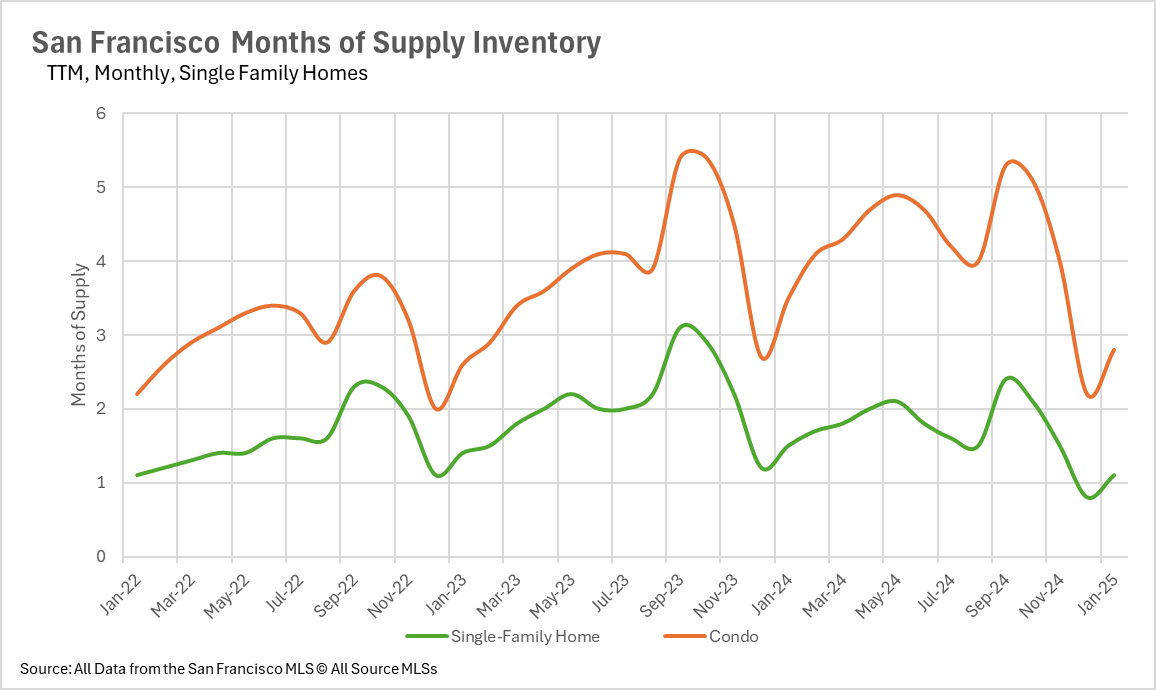
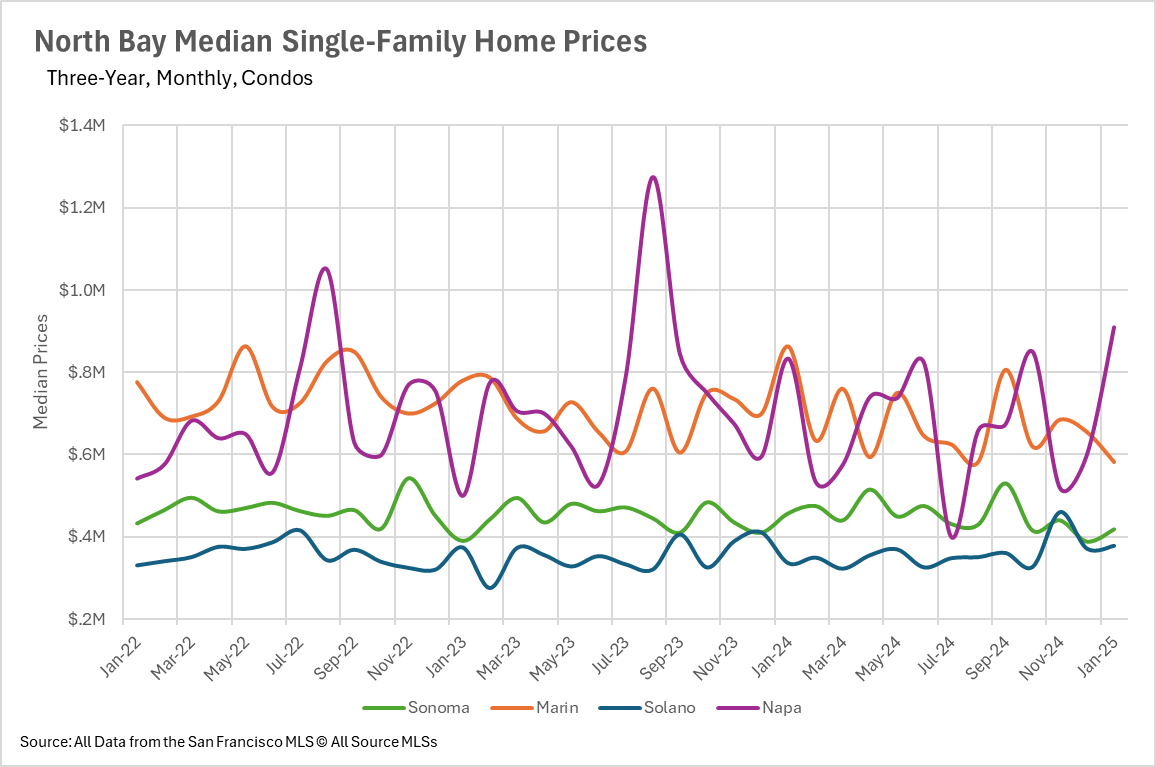
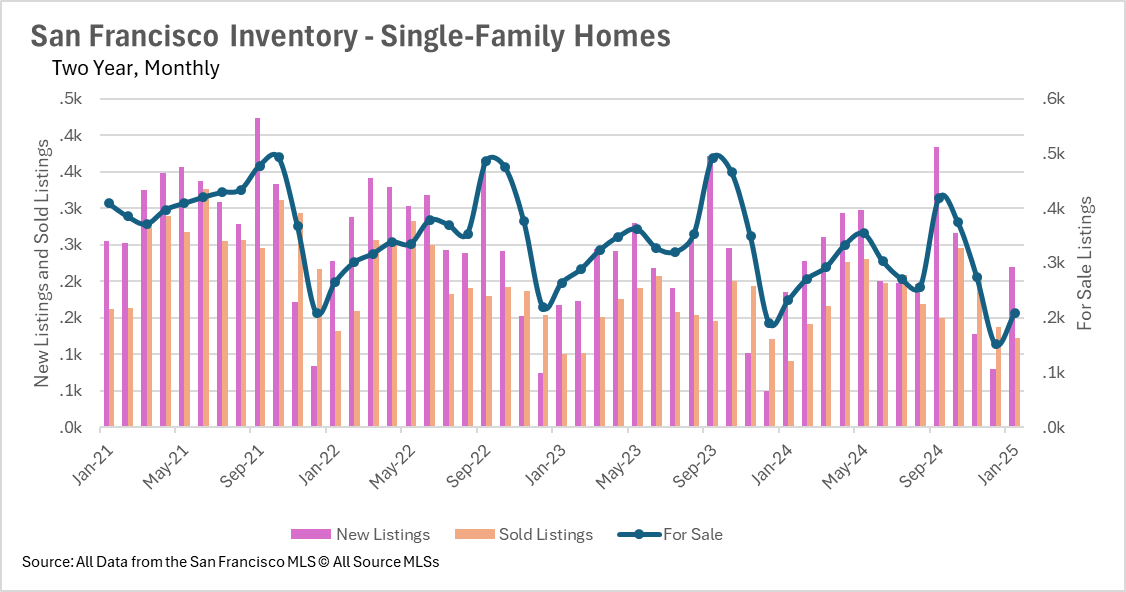
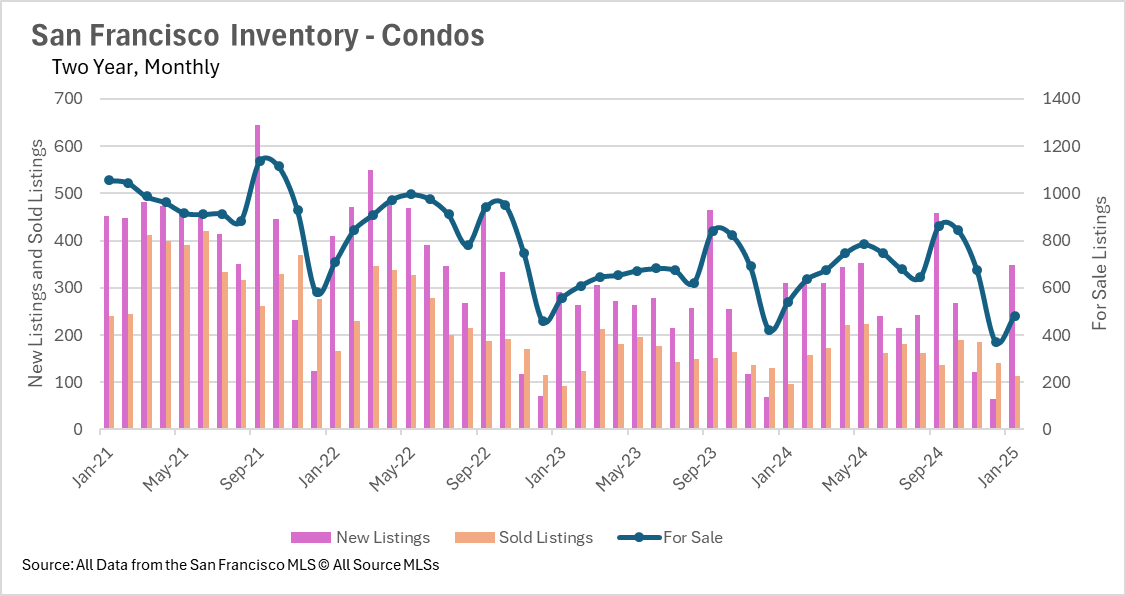
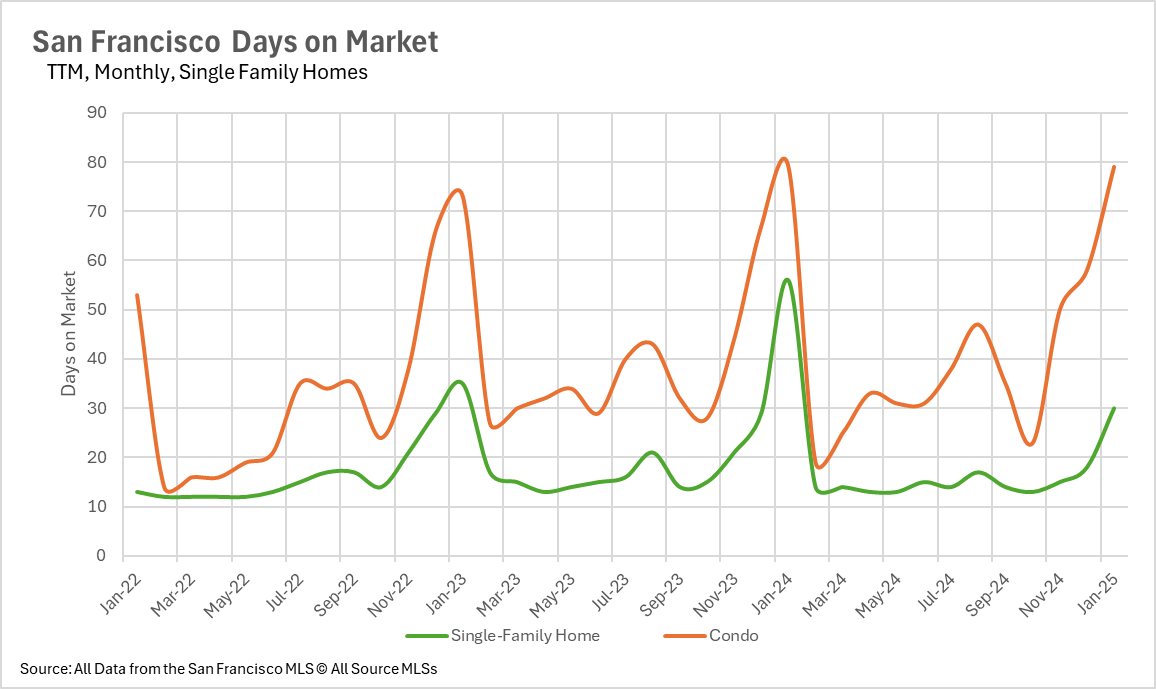
San Francisco experienced more substantial corrections, with single-family home values declining 9.68% to reach $1,422,500, while condo prices fell 8.76% to $990,000. The North Bay region displayed relative stability, though Marin County (-6.69%) and Napa County (-10.20%) relinquished some of their previous gains.
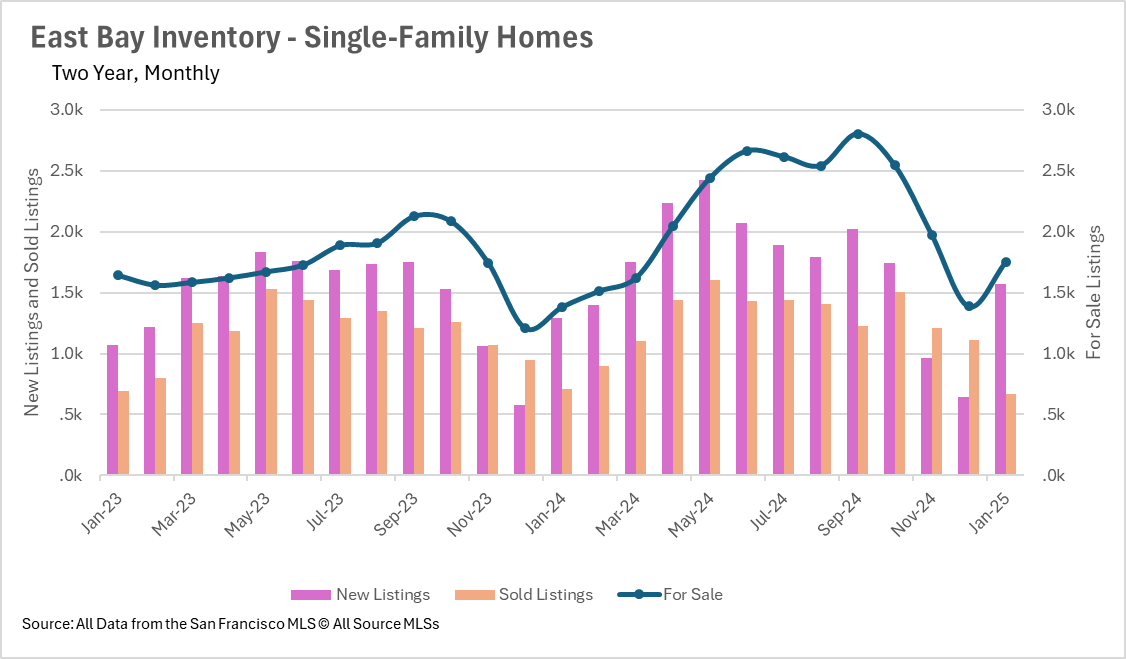
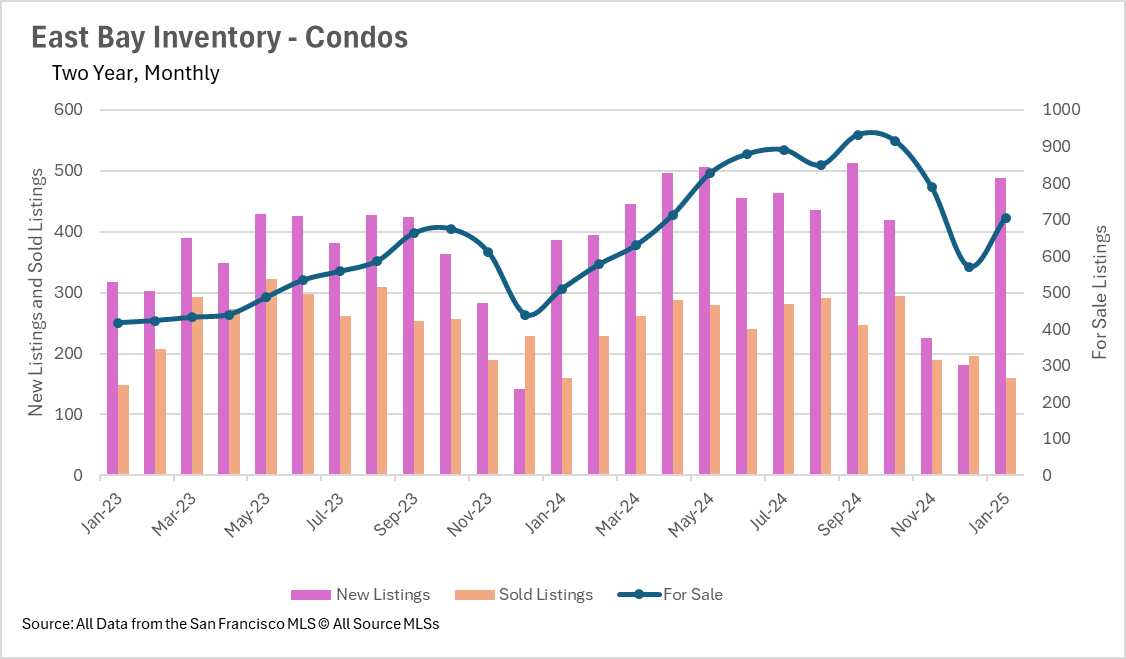
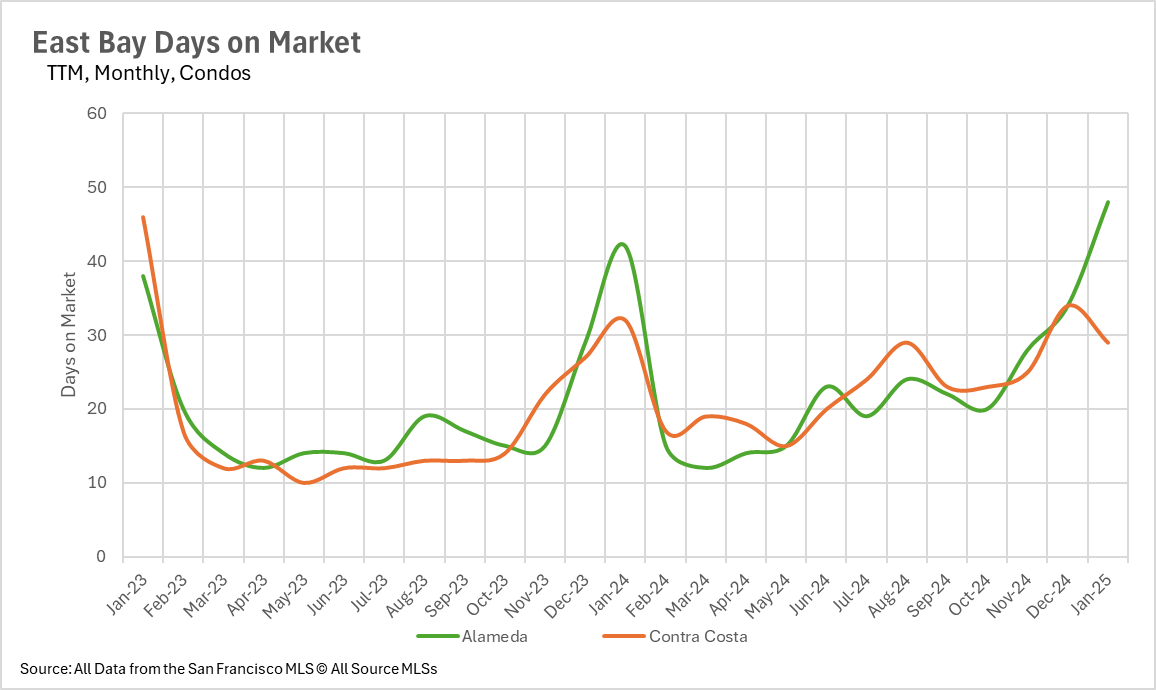
Inventory metrics highlight divergent trends across Bay Area counties. The East Bay witnessed considerable expansion in supply, with new single-family home listings increasing 21.59% and active listings growing 26.39%. Contra Costa's condo market showed even more dramatic supply growth, with new listings up 26.42% and active inventory surging 38.24%.
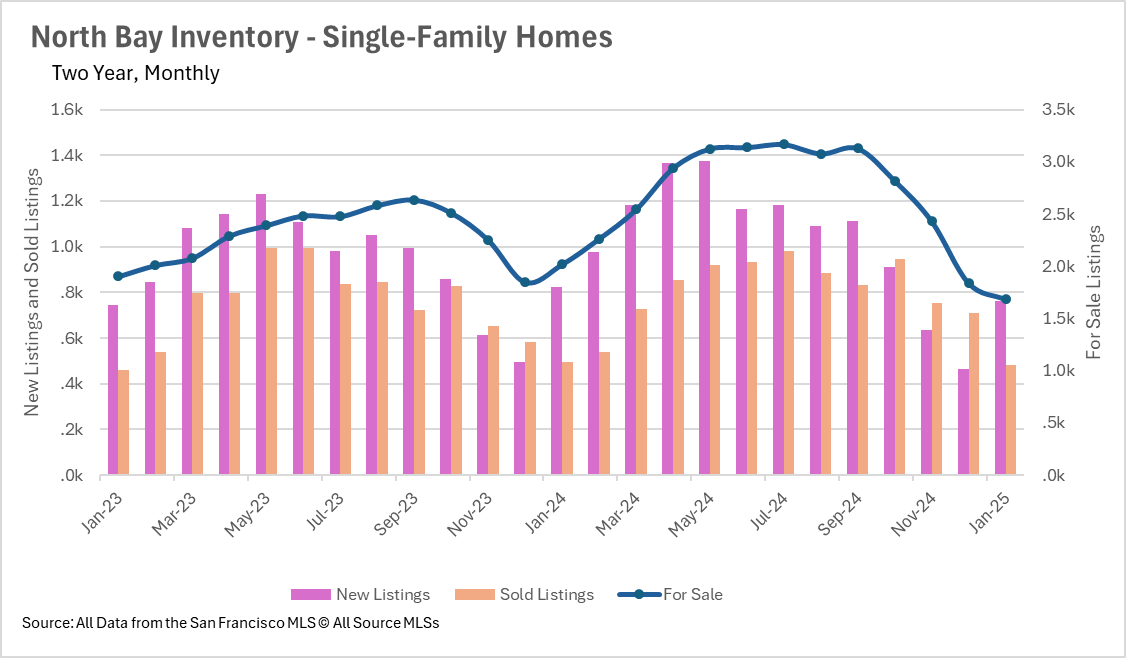
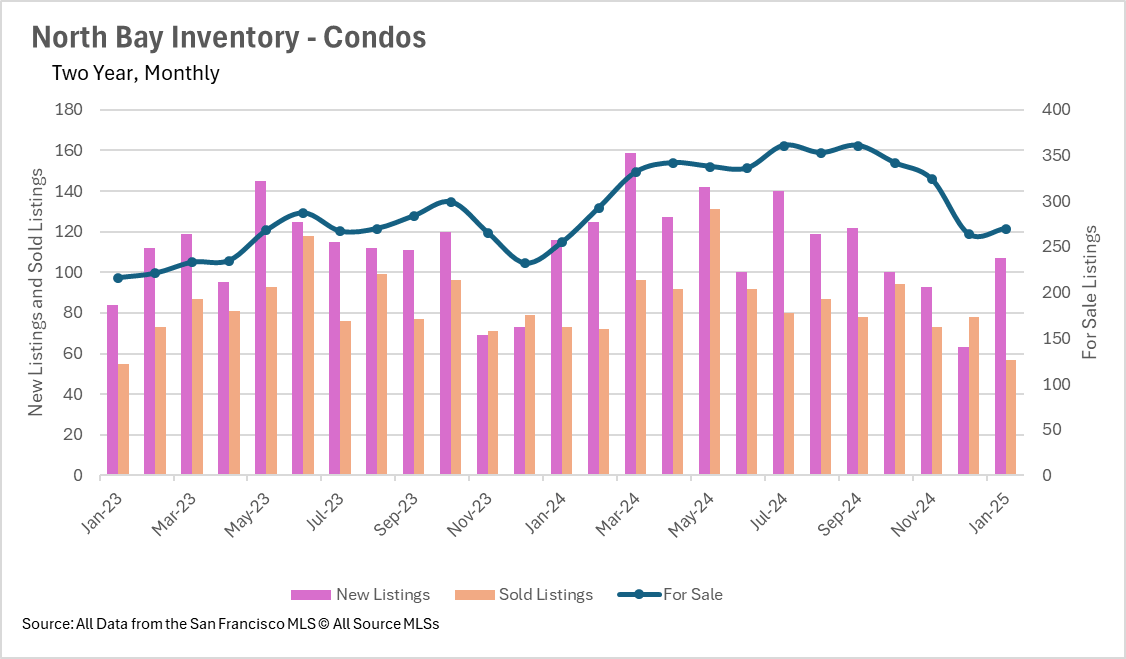
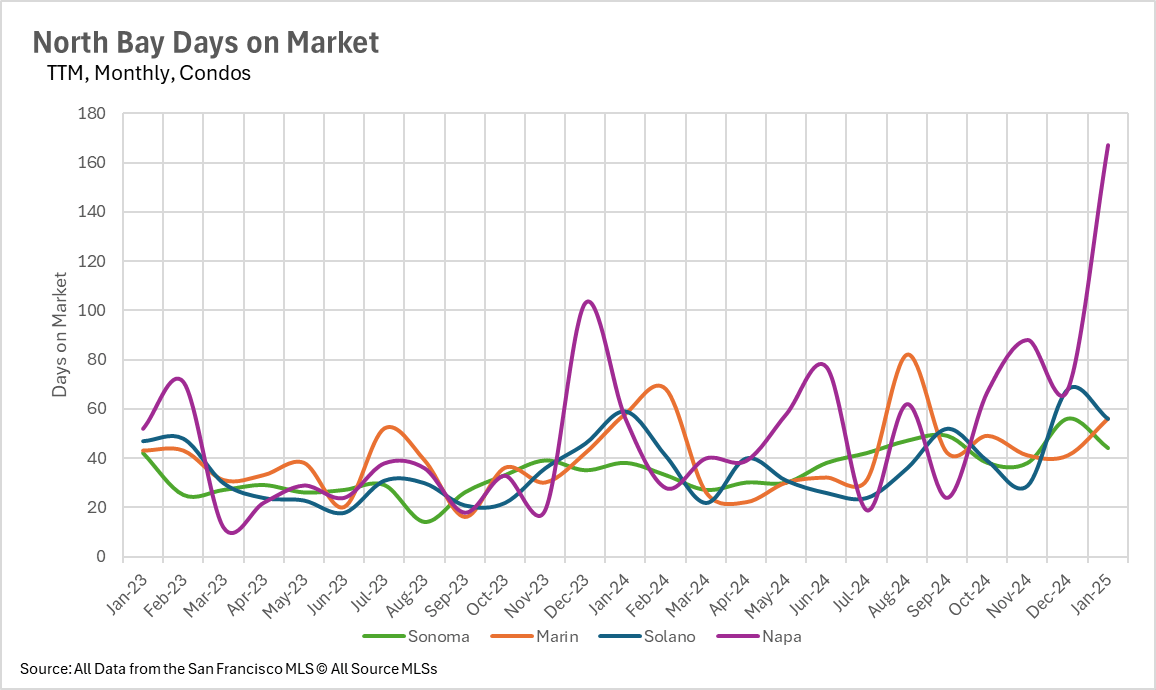
Conversely, the North Bay experienced a 16.55% reduction in active single-family listings, contributing to market tightness. San Francisco's inventory remains constrained, showing declines in both single-family (-10.34%) and condo (-10.91%) active listings.
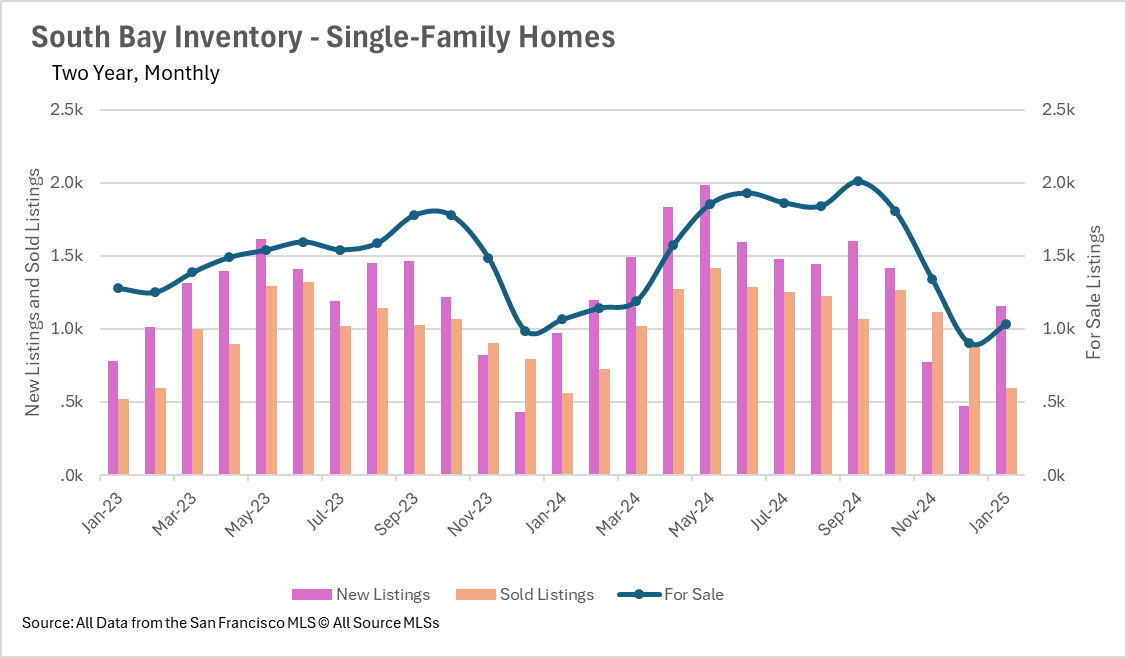
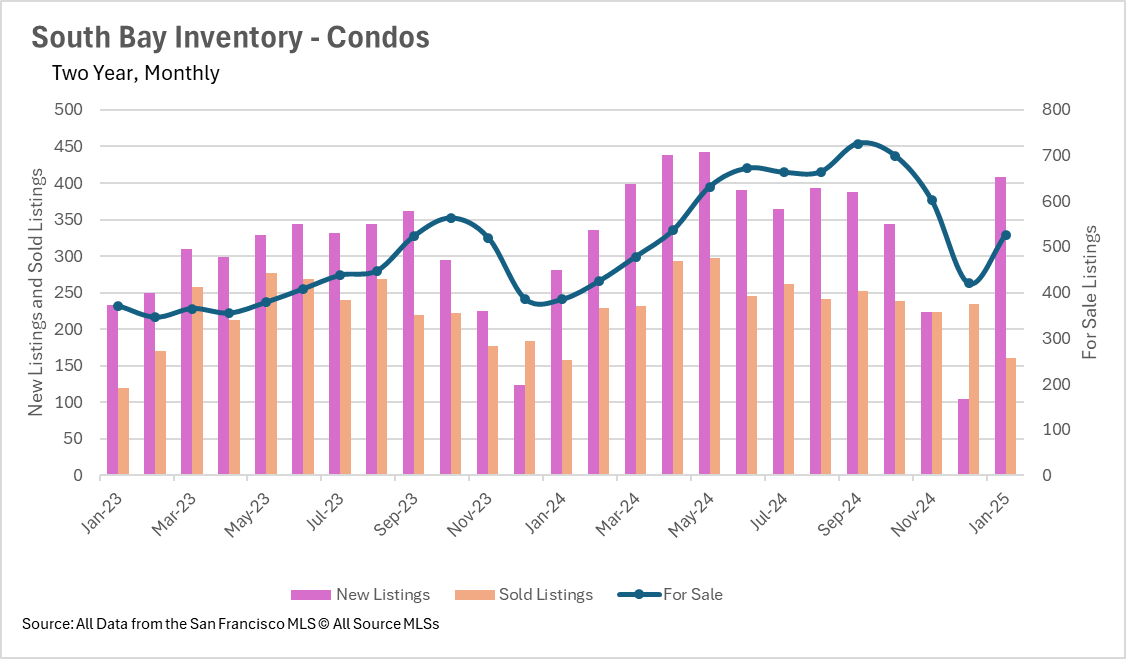
South Bay's condo segment stands as a notable exception, with active listings climbing 36.62% and new listings jumping 45.2%, potentially creating advantageous conditions for buyers.
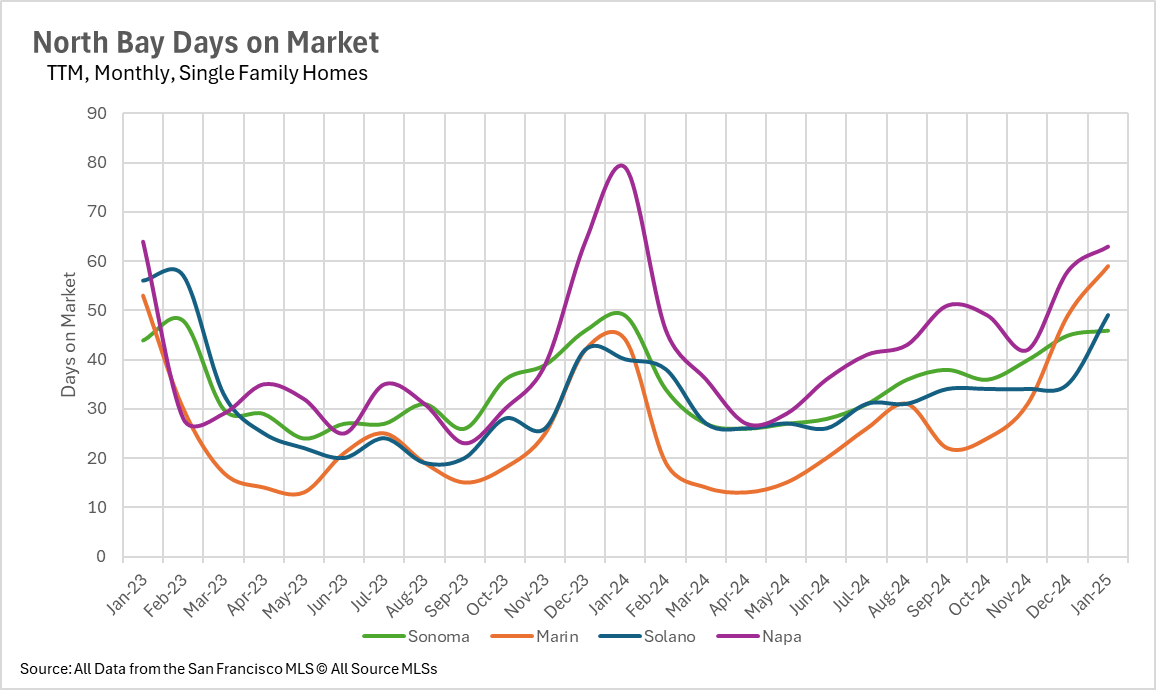
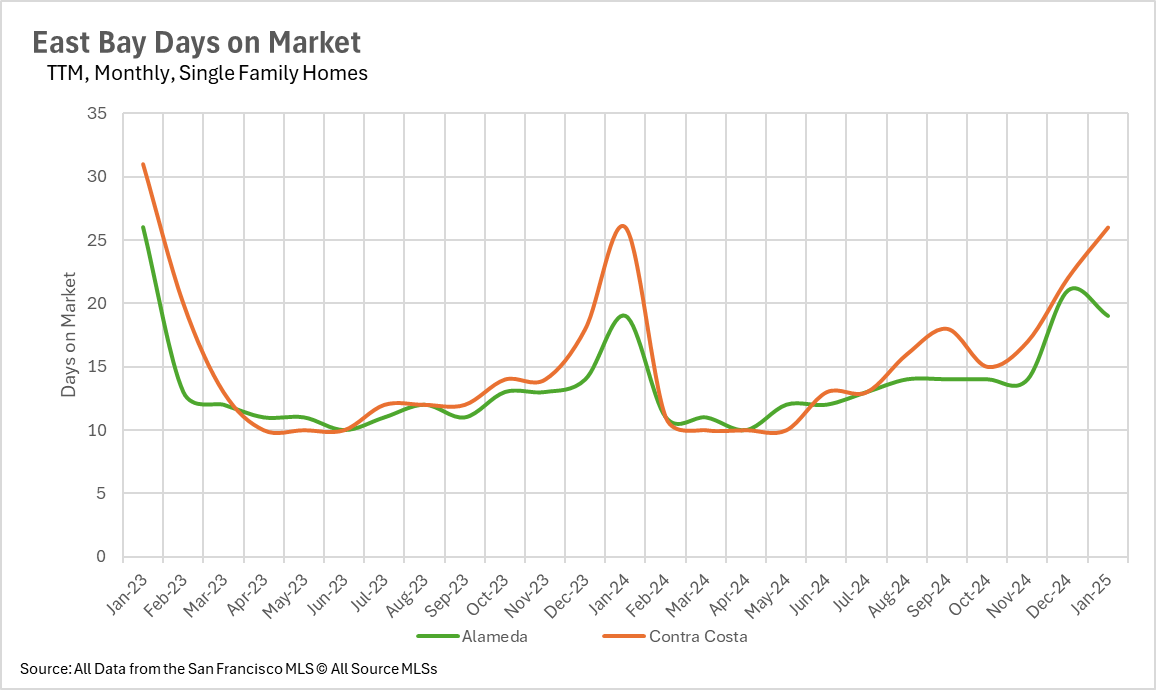
Days-on-market statistics reveal varying market velocities. In the East Bay, Contra Costa single-family properties spend 26% more time listed than their Alameda counterparts. Alameda condos remain on market 65% longer than those in Contra Costa. Marin County's single-family homes show a 34% increase in marketing time, while Napa condos experienced a dramatic 198% increase in days-on-market.
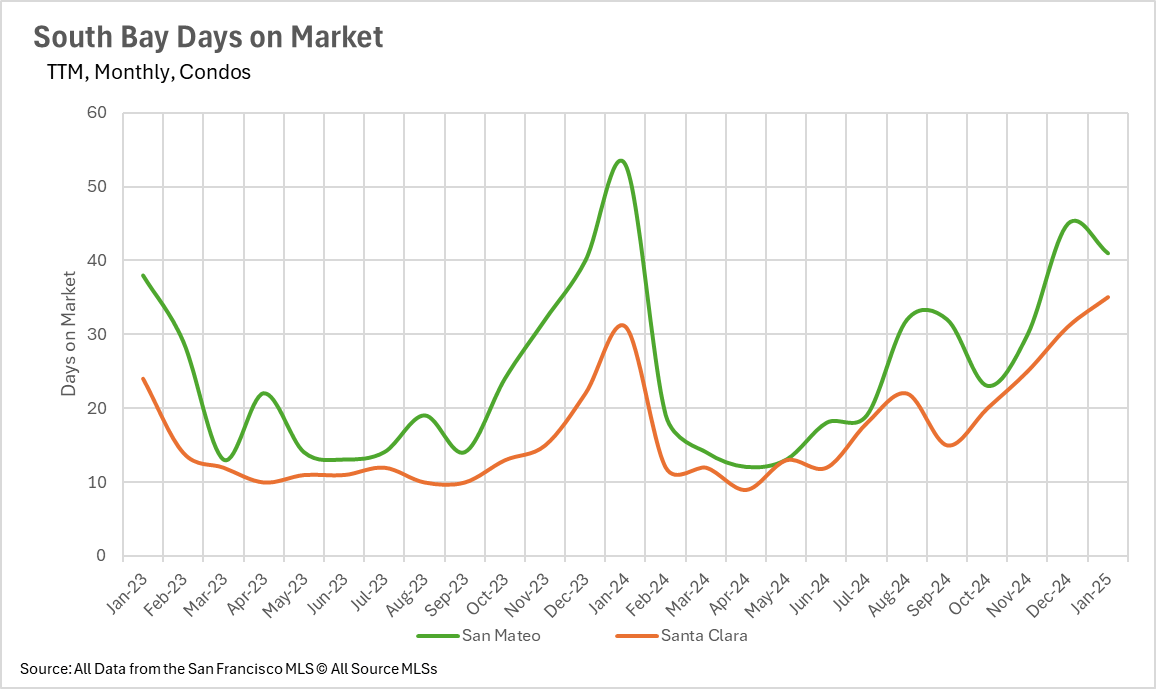
South Bay's single-family segment maintains intense competition, with properties selling within just 12-32 days. Meanwhile, Santa Clara and Santa Cruz condos are taking 12.9% and 6.45% longer to sell, respectively.
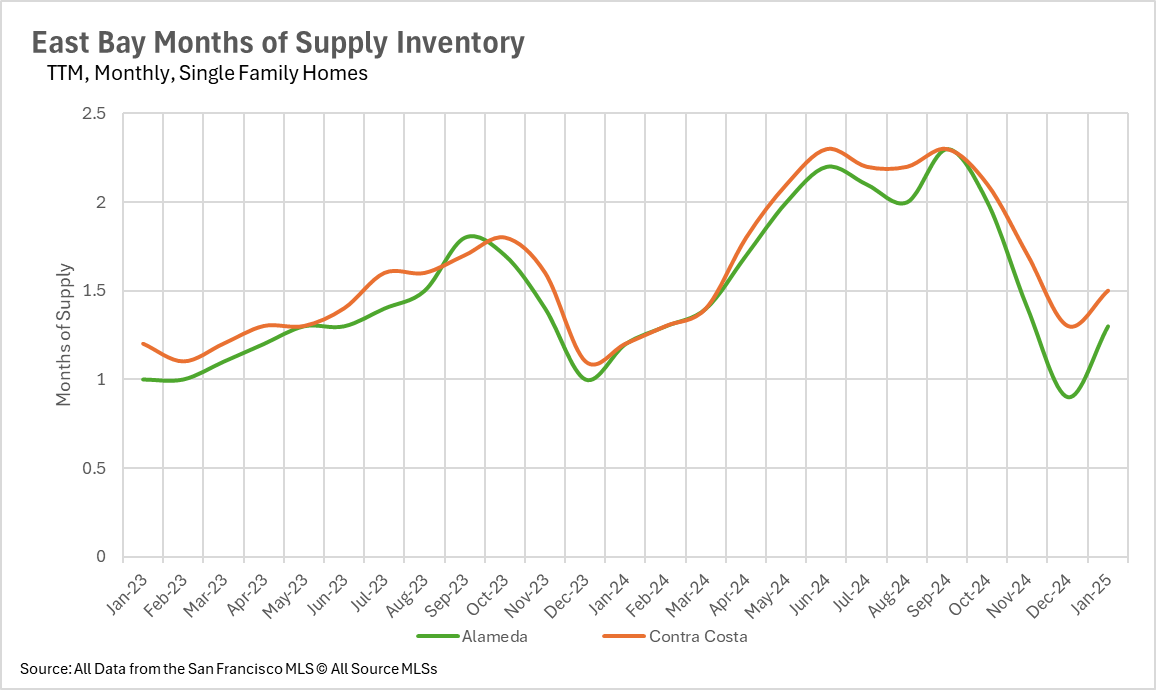
Most Bay Area submarkets continue to operate as seller's markets based on months-of-supply metrics. East Bay single-family homes remain decisively seller-favorable, with Alameda (1.3 months) and Contra Costa (1.5 months) showing tight supply, while their condo markets approach balanced conditions.
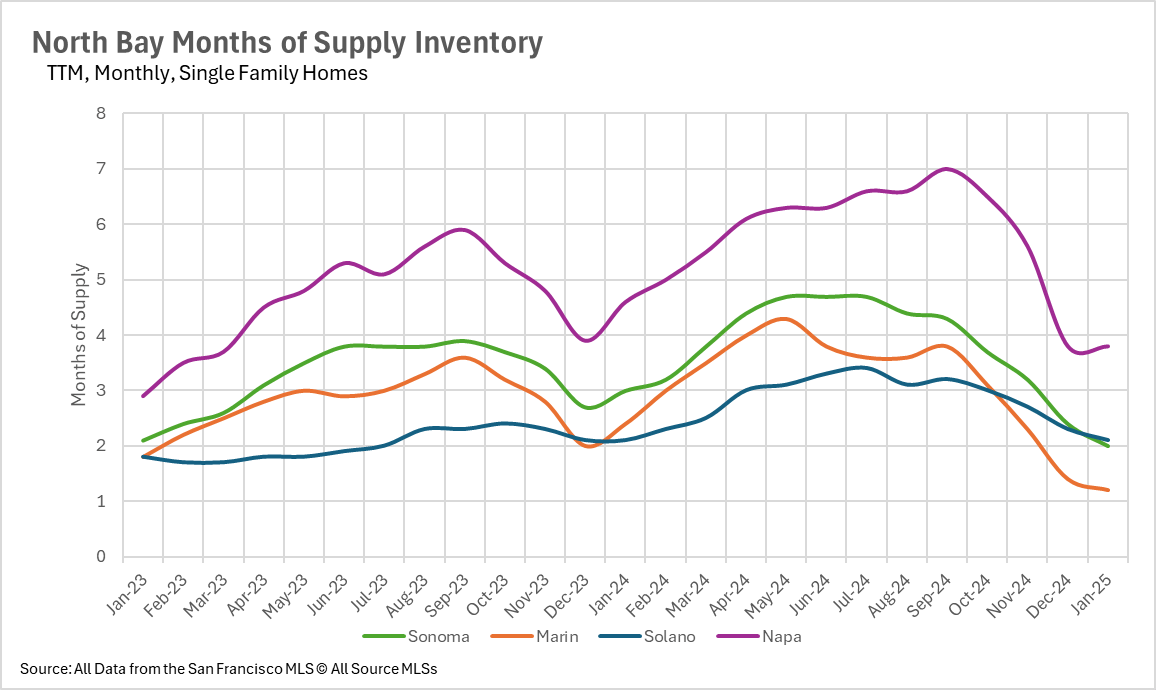
Napa County represents a true buyer's market with 3.8 months of supply, contrasting with seller-dominated Sonoma (2.0), Marin (1.2), and Solano (2.1) counties. San Francisco heavily favors sellers with just 1.1 months of single-family inventory and 2.8 months for condos.
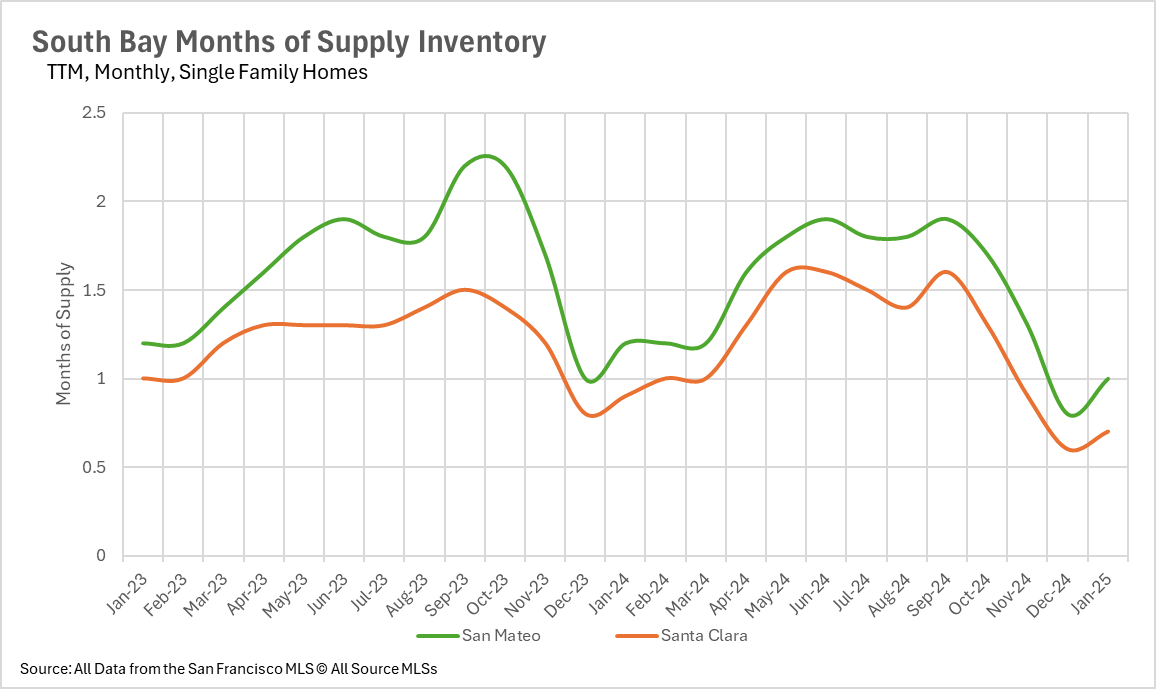
South Bay's single-family segment remains among the region's most competitive, with Santa Clara showing exceptionally tight 0.7 months of inventory. Conversely, Santa Cruz condos (3.7 months supply) offer buyers increased leverage.
With persistent demand and limited inventory across many submarkets, competition will likely remain intense. However, expanding condo inventory in specific areas, particularly Napa and Santa Cruz, may present uncommon buying windows. As spring approaches, evolving inventory levels and interest rate movements will determine market direction, underscoring the importance of staying current with local conditions.

Thinking of buying or selling? Contact me today!
Stay up to date on the latest real estate trends.

June 27, 2026

June 27, 2026

June 20, 2026

June 11, 2026

June 5, 2026

May 23, 2026

May 15, 2026

May 1, 2026

April 24, 2026
You've got questions and we can't wait to answer them.