October Newsletter
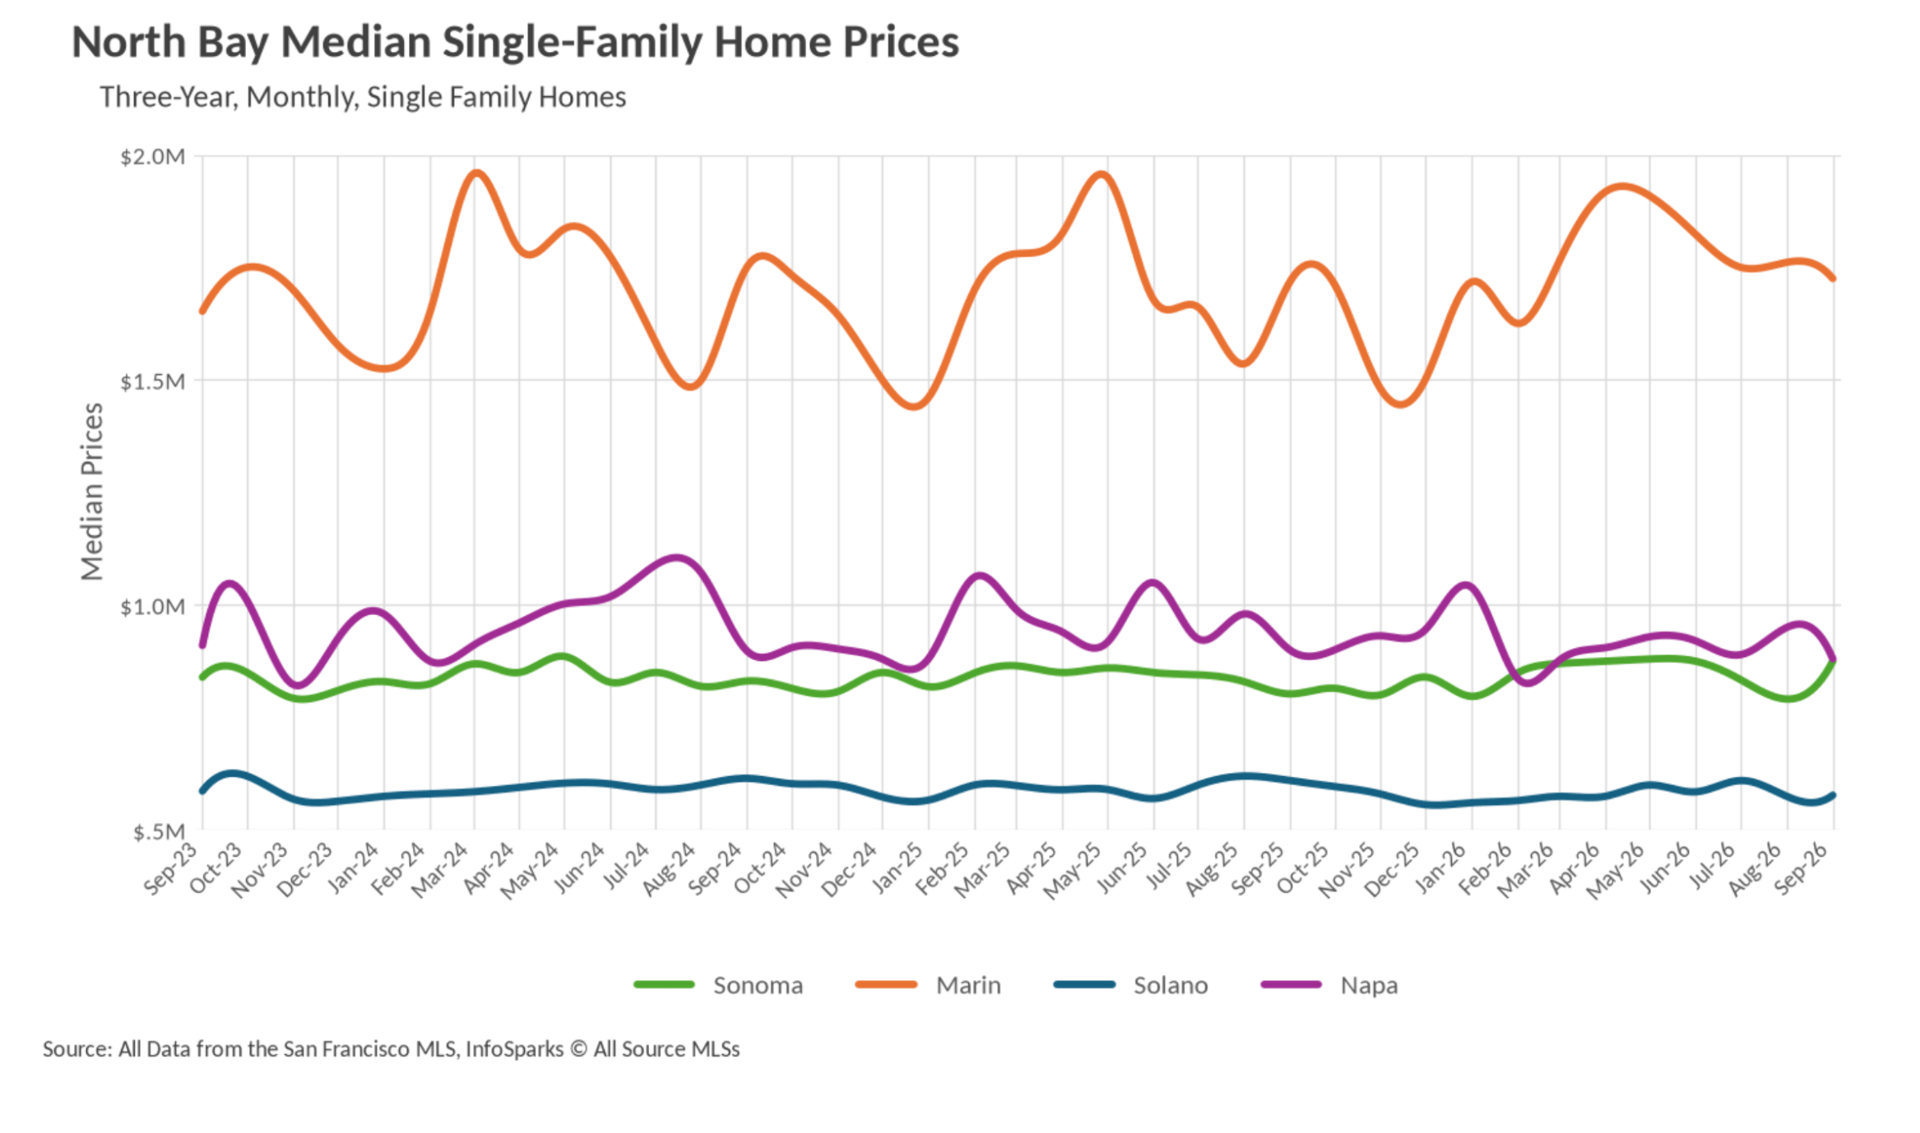
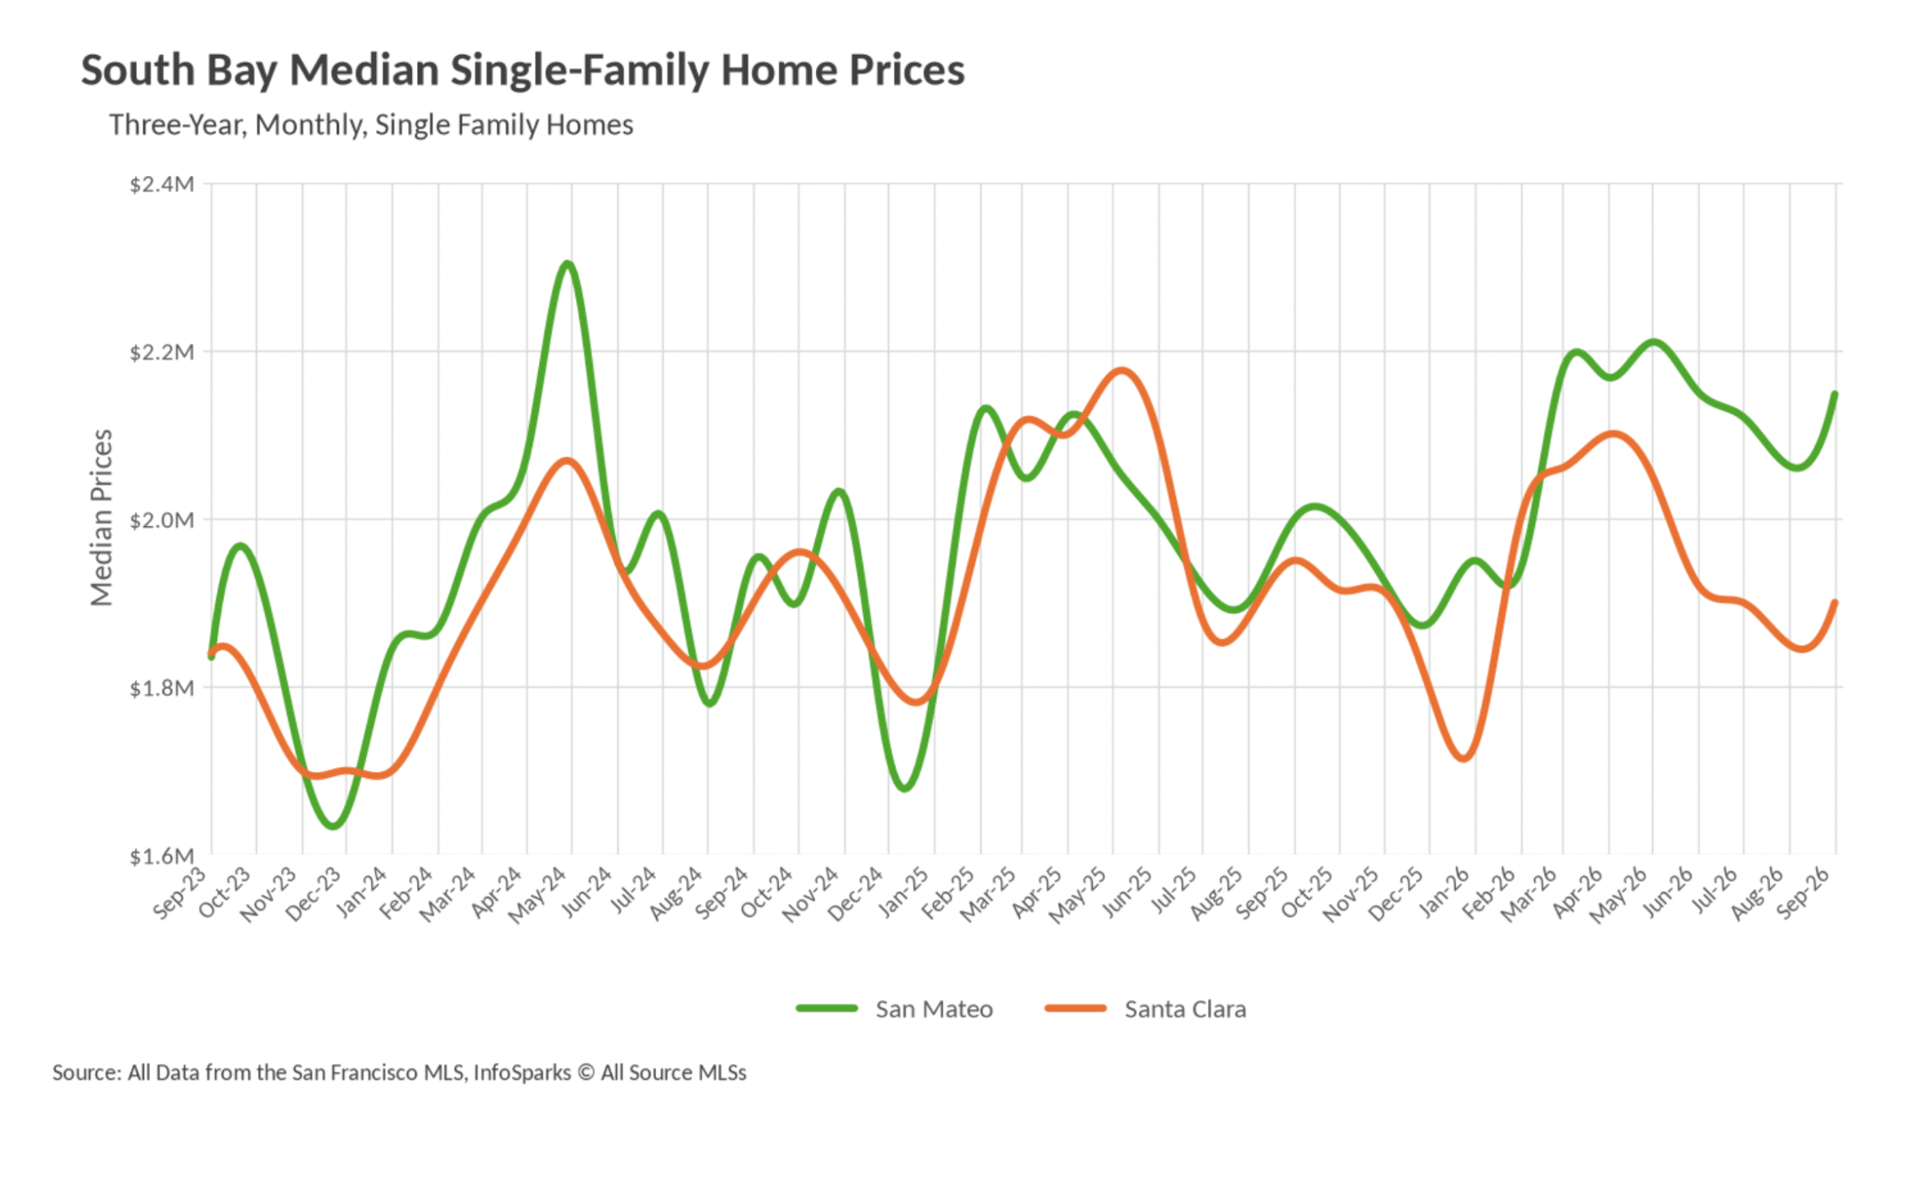
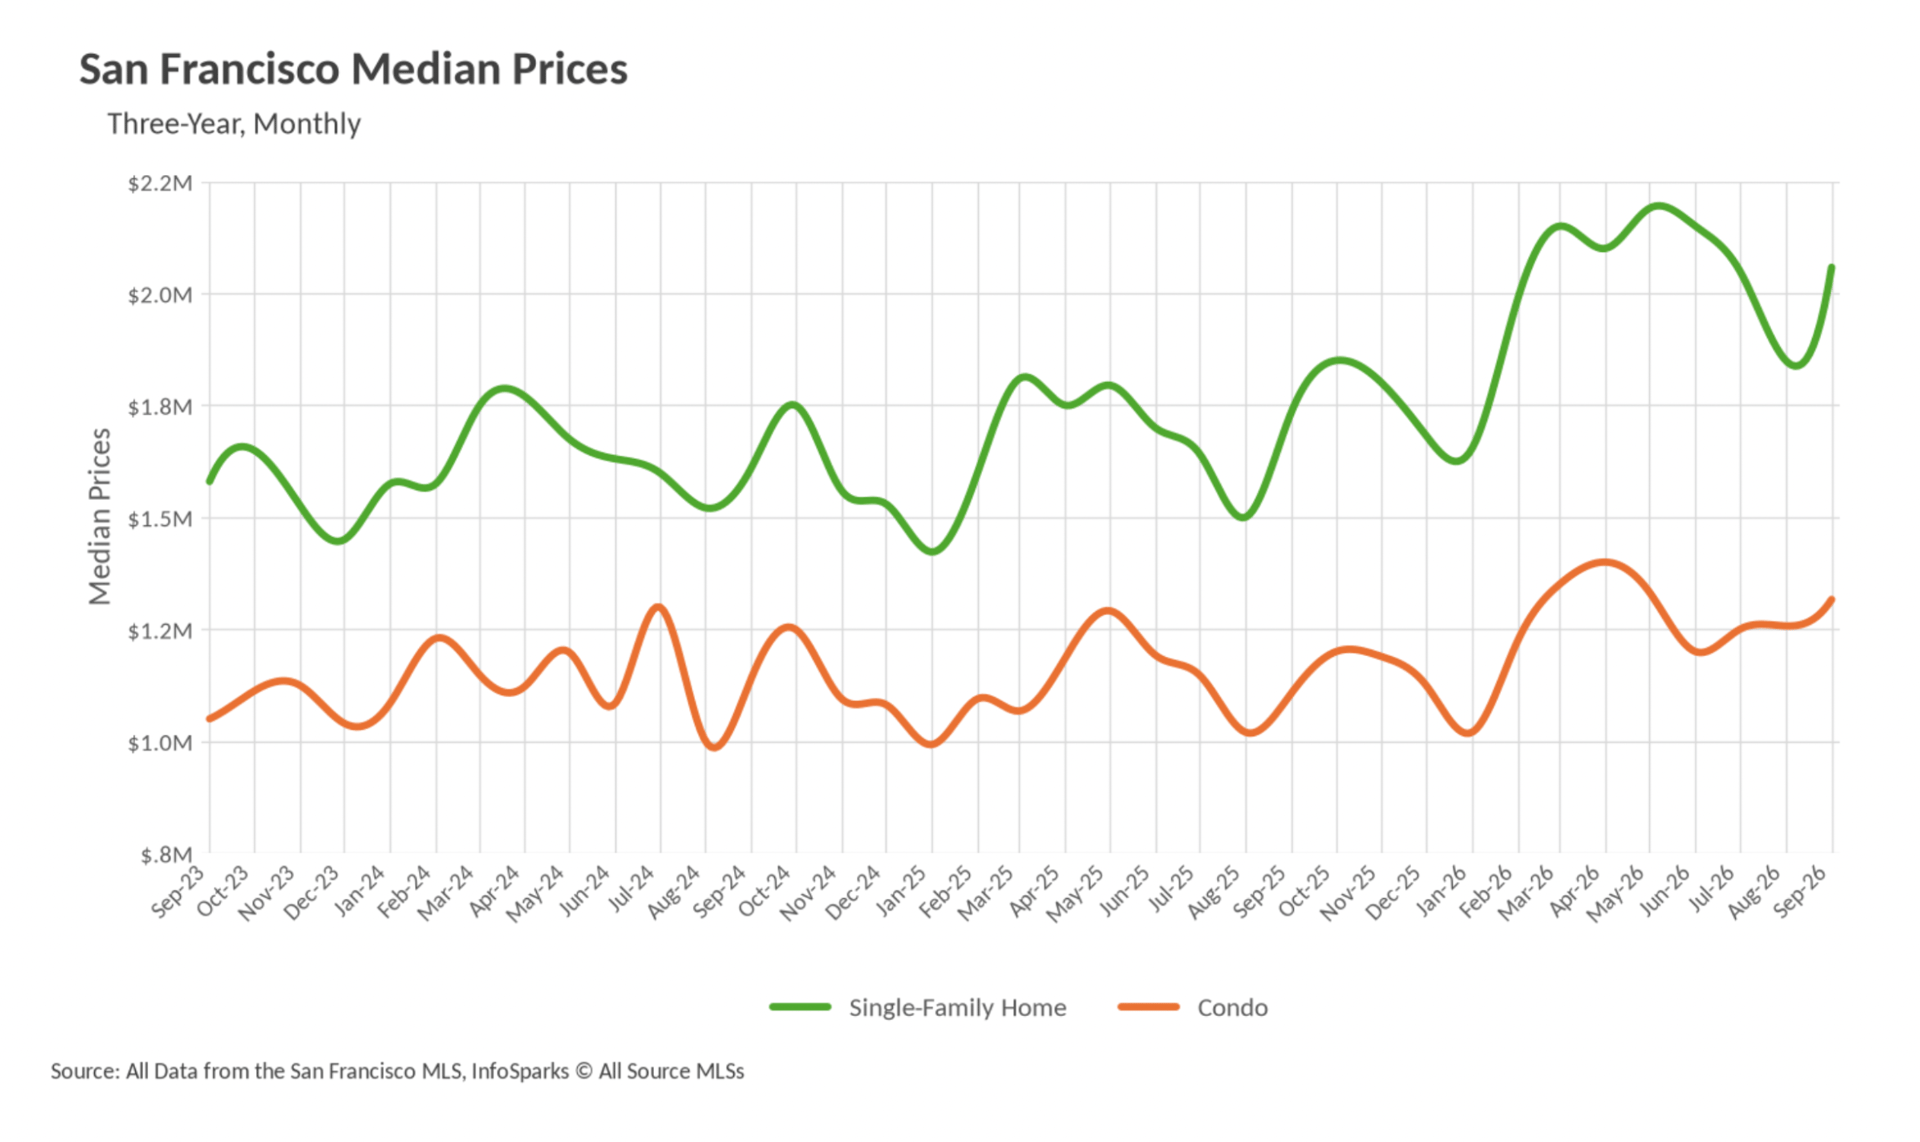
Detached homes carried the Bay Area in September, with San Francisco posting a $2,054,000 median (an 18.39% year-over-year gain) and San Mateo County holding the top spot at $2,129,000 (up 6.50%). Solano County was the lone significant exception, sliding 5.74% to $575,000.
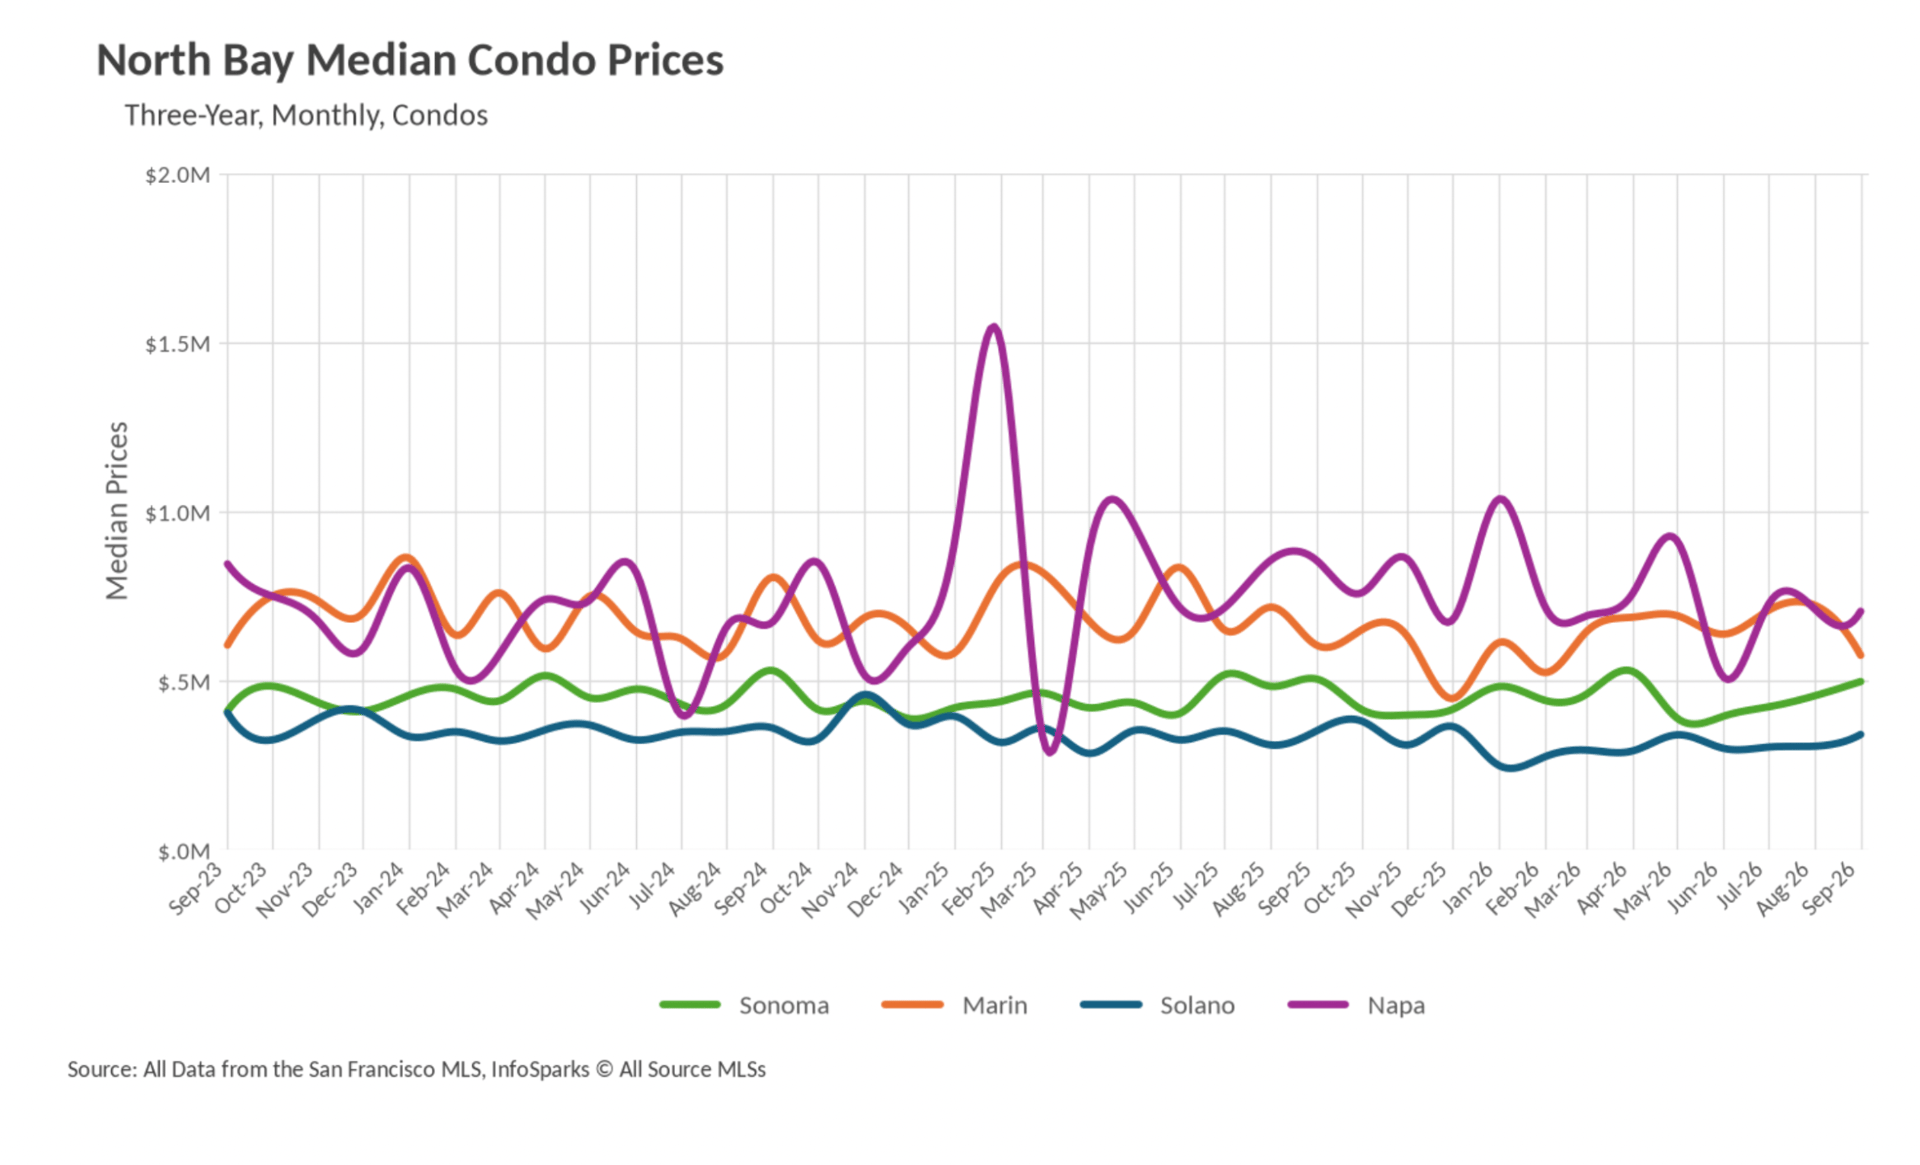
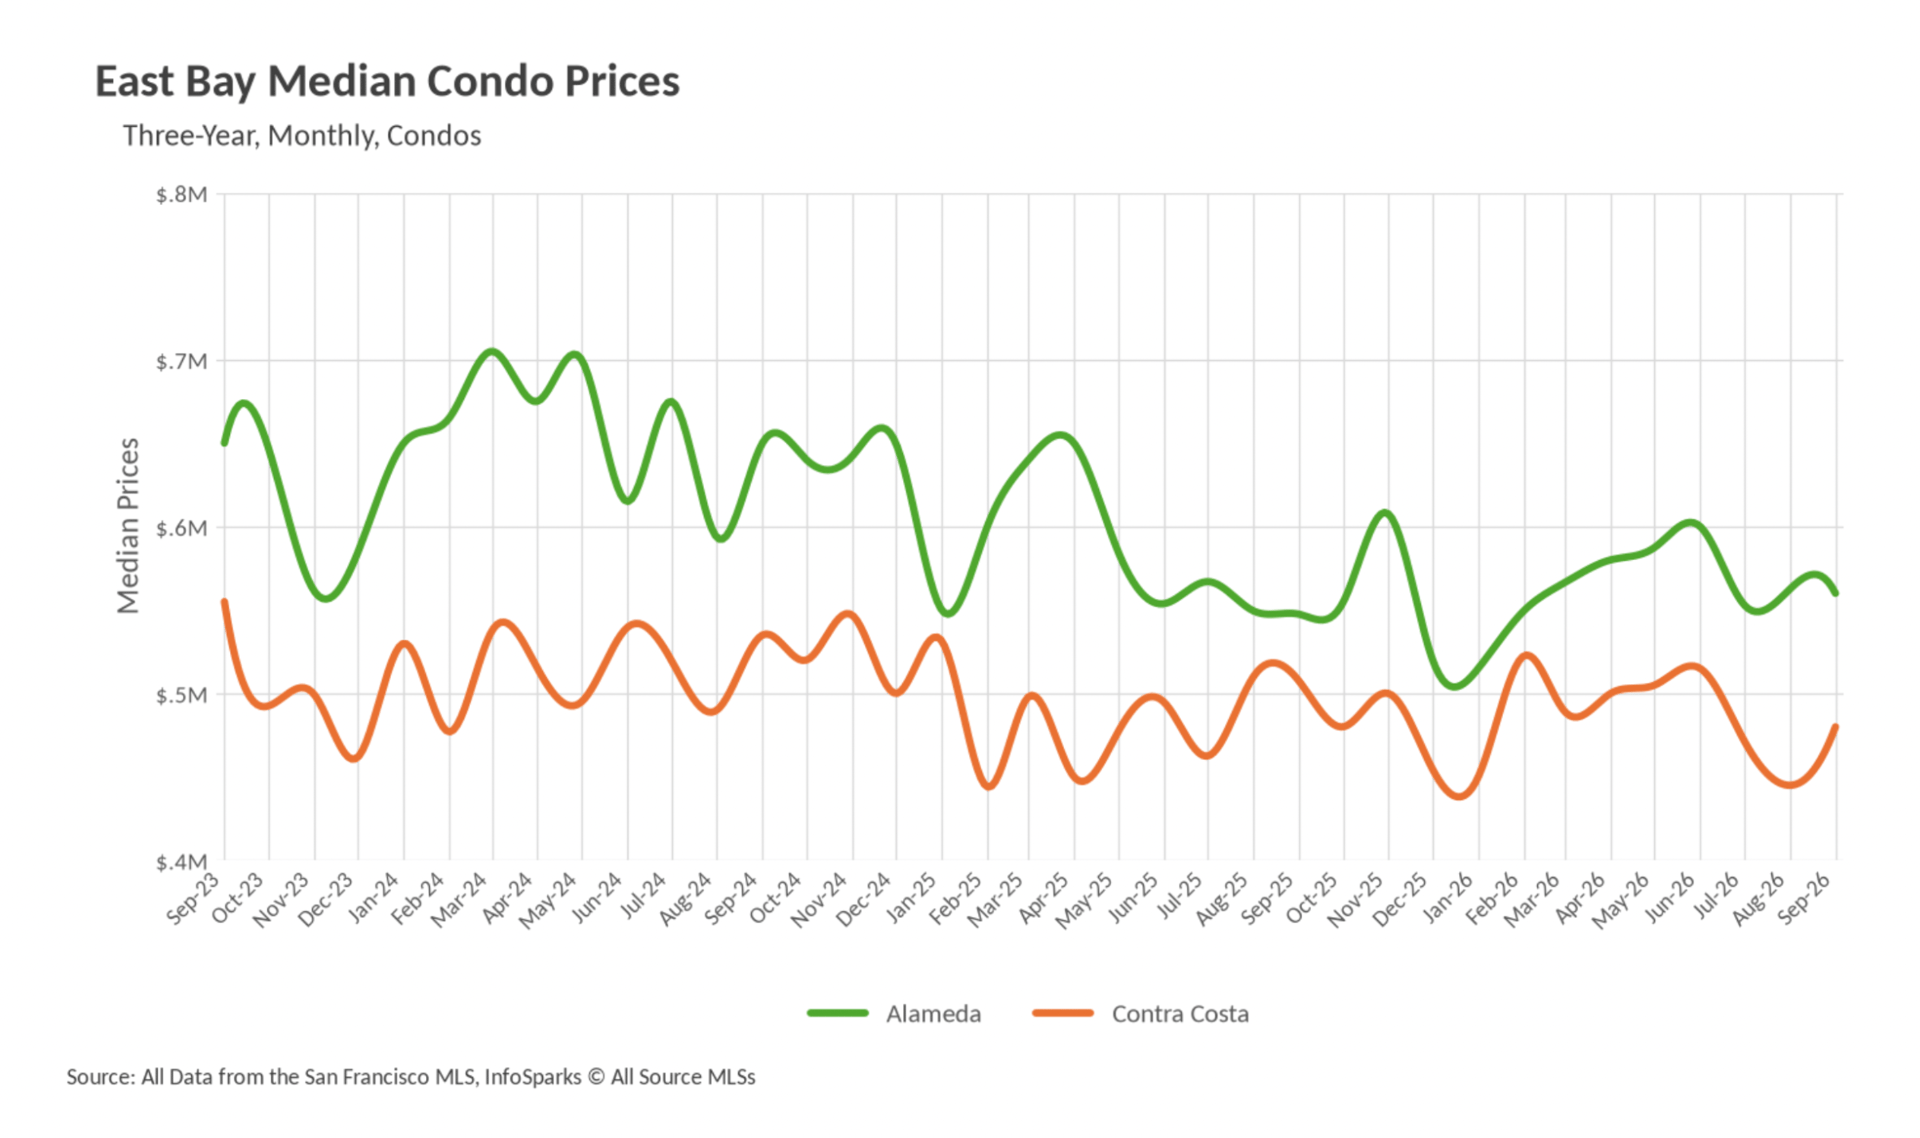
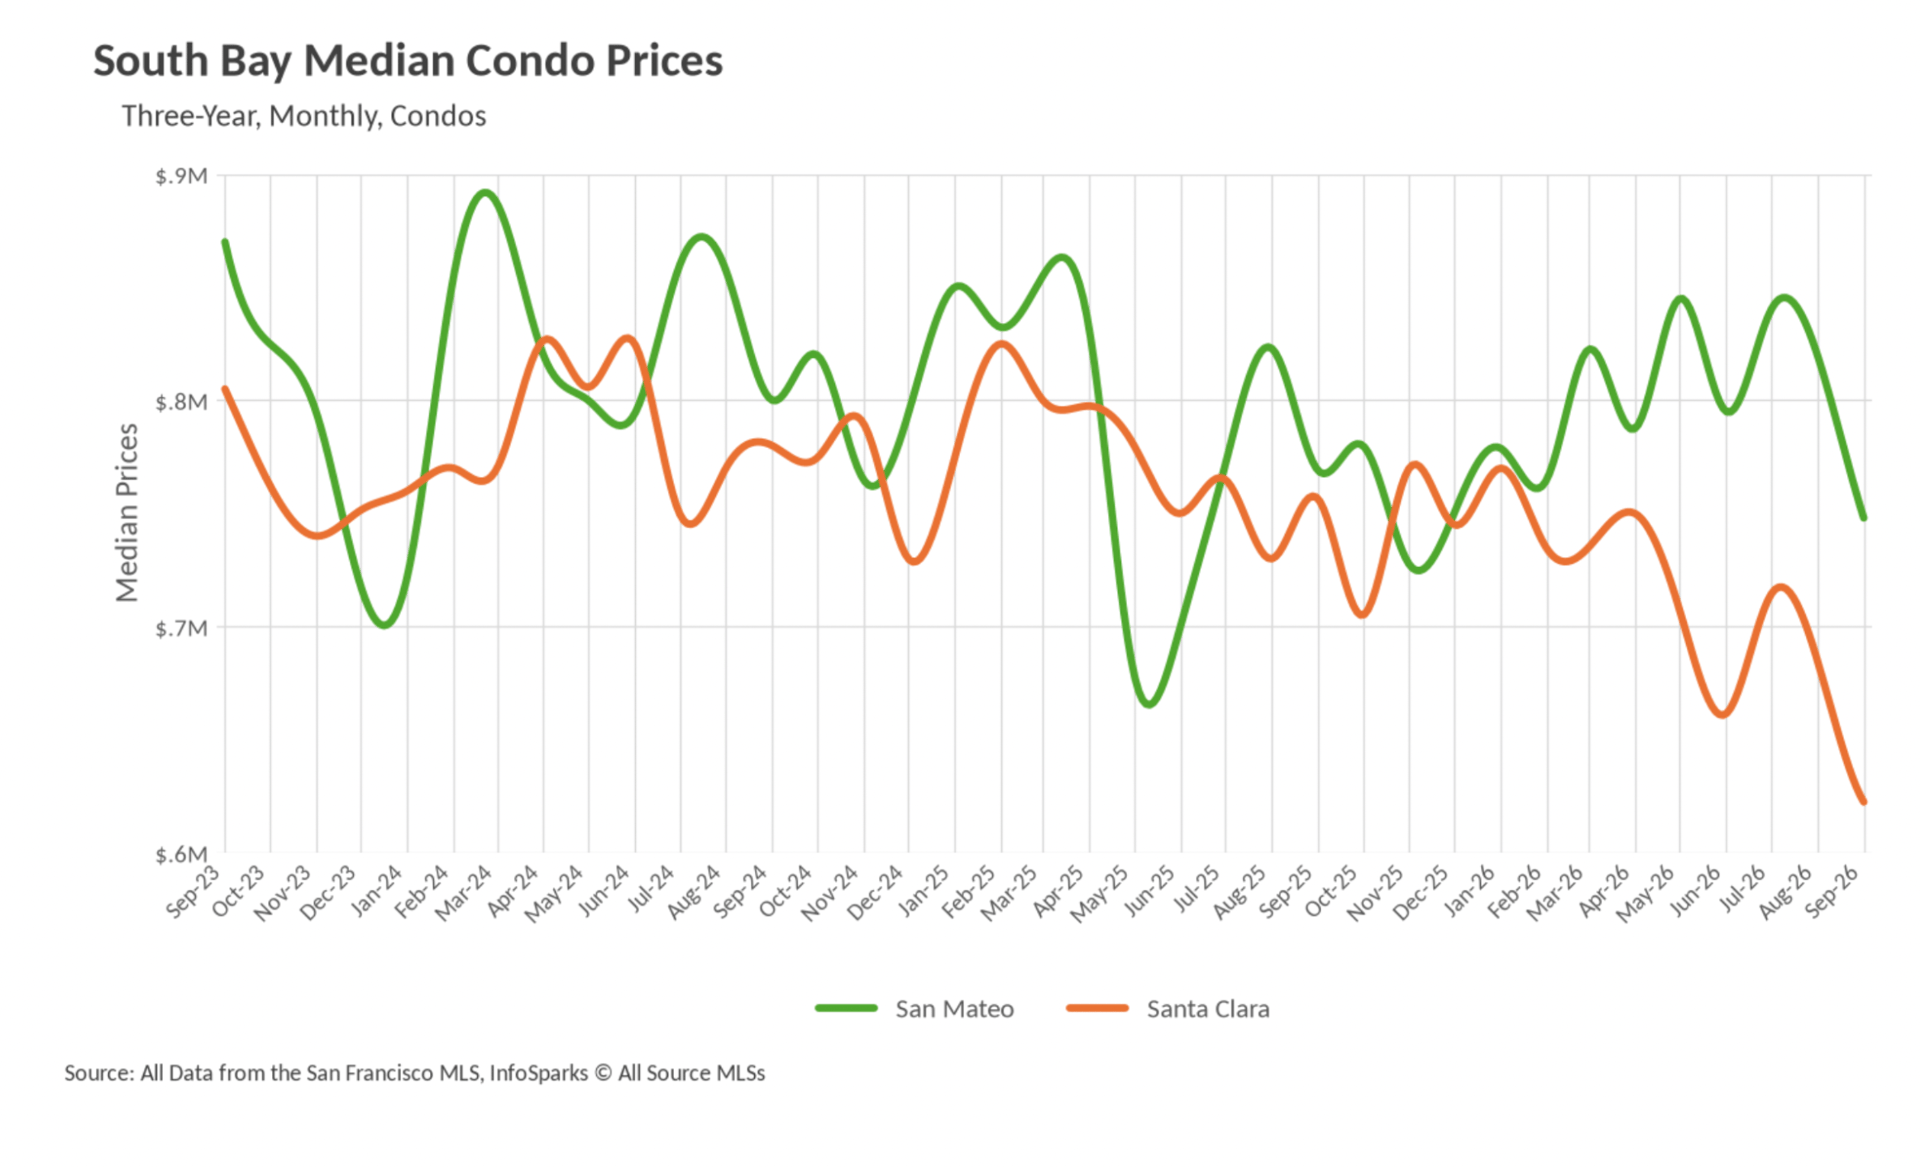
The condo market split sharply from the houses. San Francisco attached product jumped 18.87% from a year ago to $1,316,500 and Alameda County added 2.28%, but the remaining eight counties all finished below last September, with Santa Clara, Santa Cruz, and Napa each shedding 17% or more.
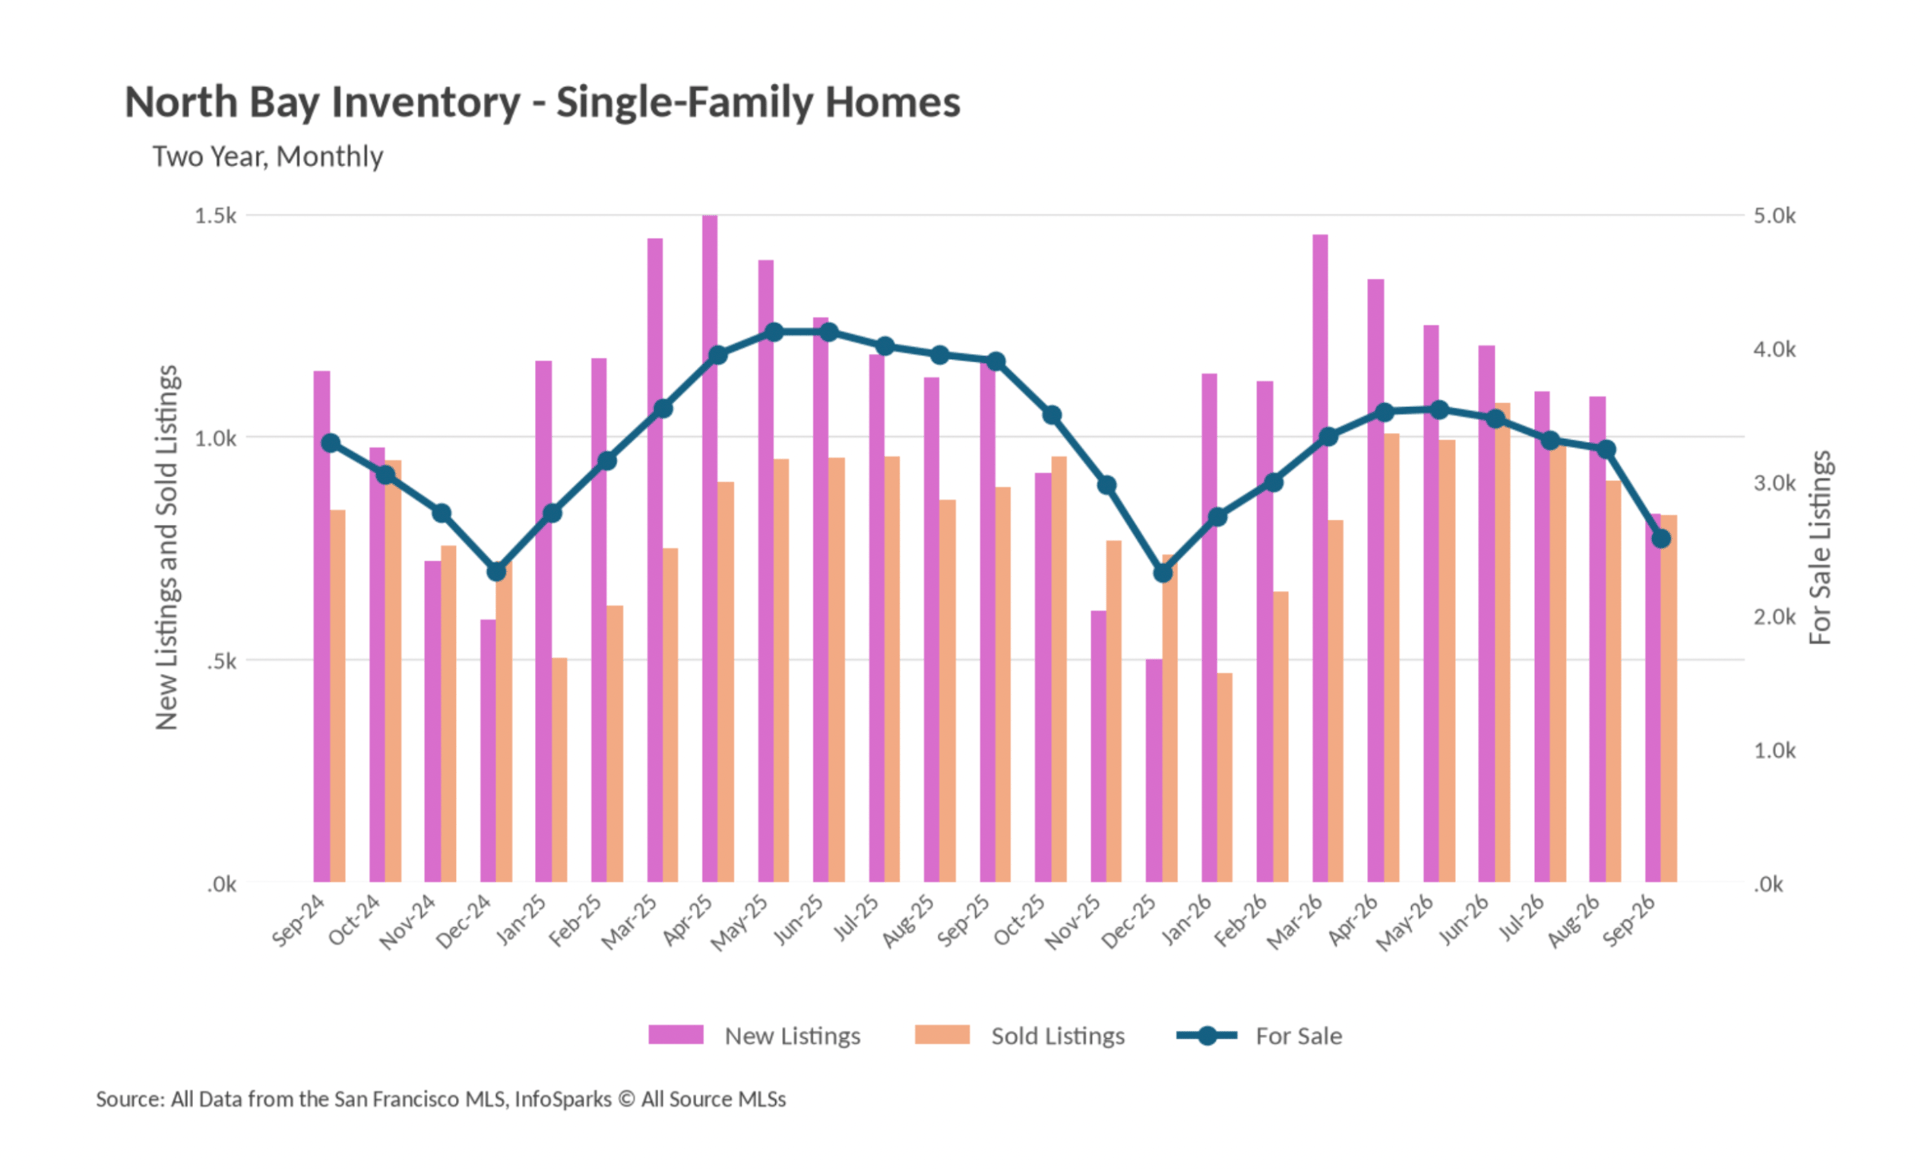
Supply is the tightest it has been in some time. About 7,700 single-family listings were available region-wide versus roughly 9,700 last September, a contraction of nearly 21%, and condo inventory is down a similar 18%.
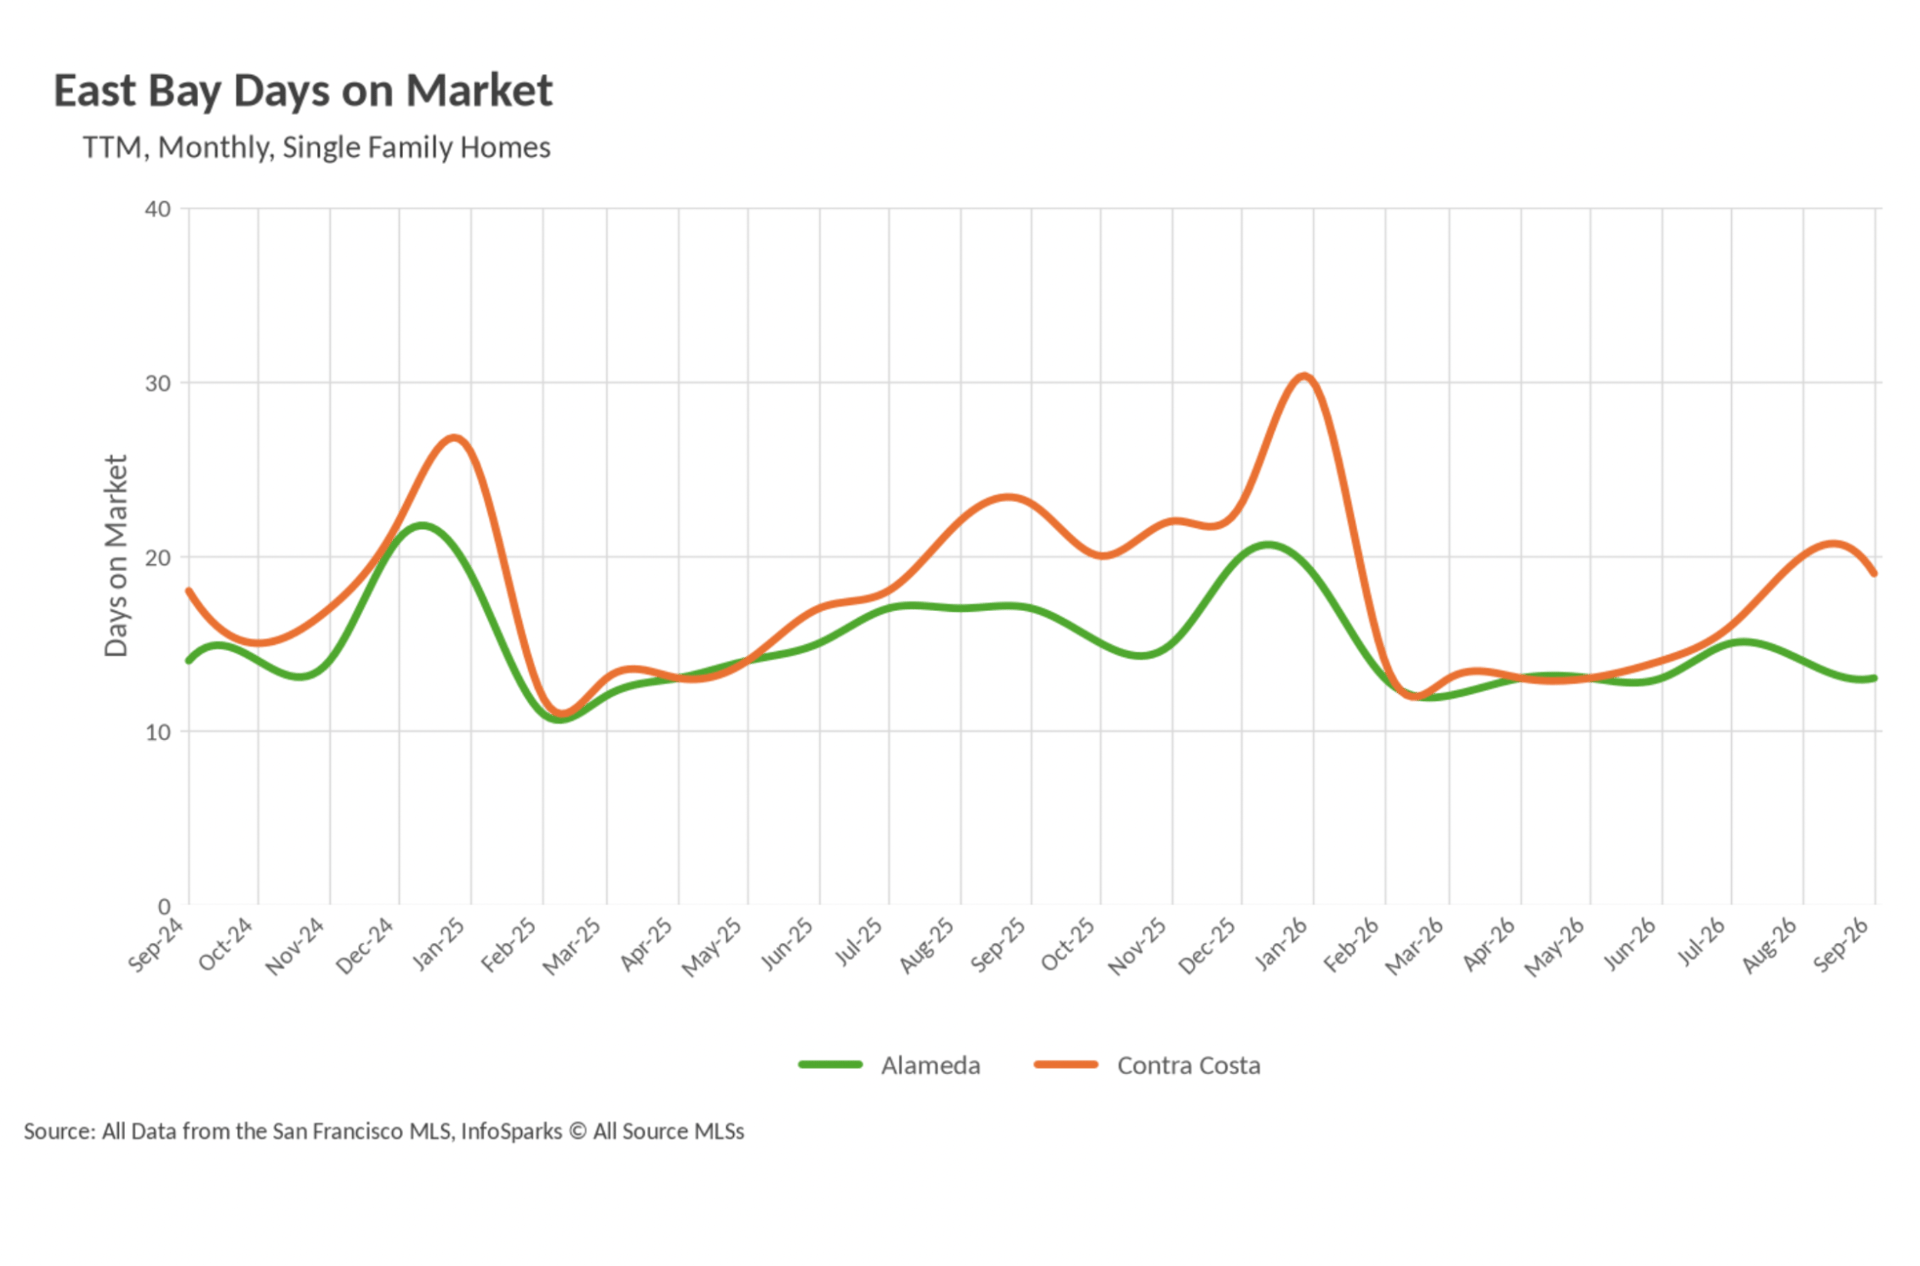
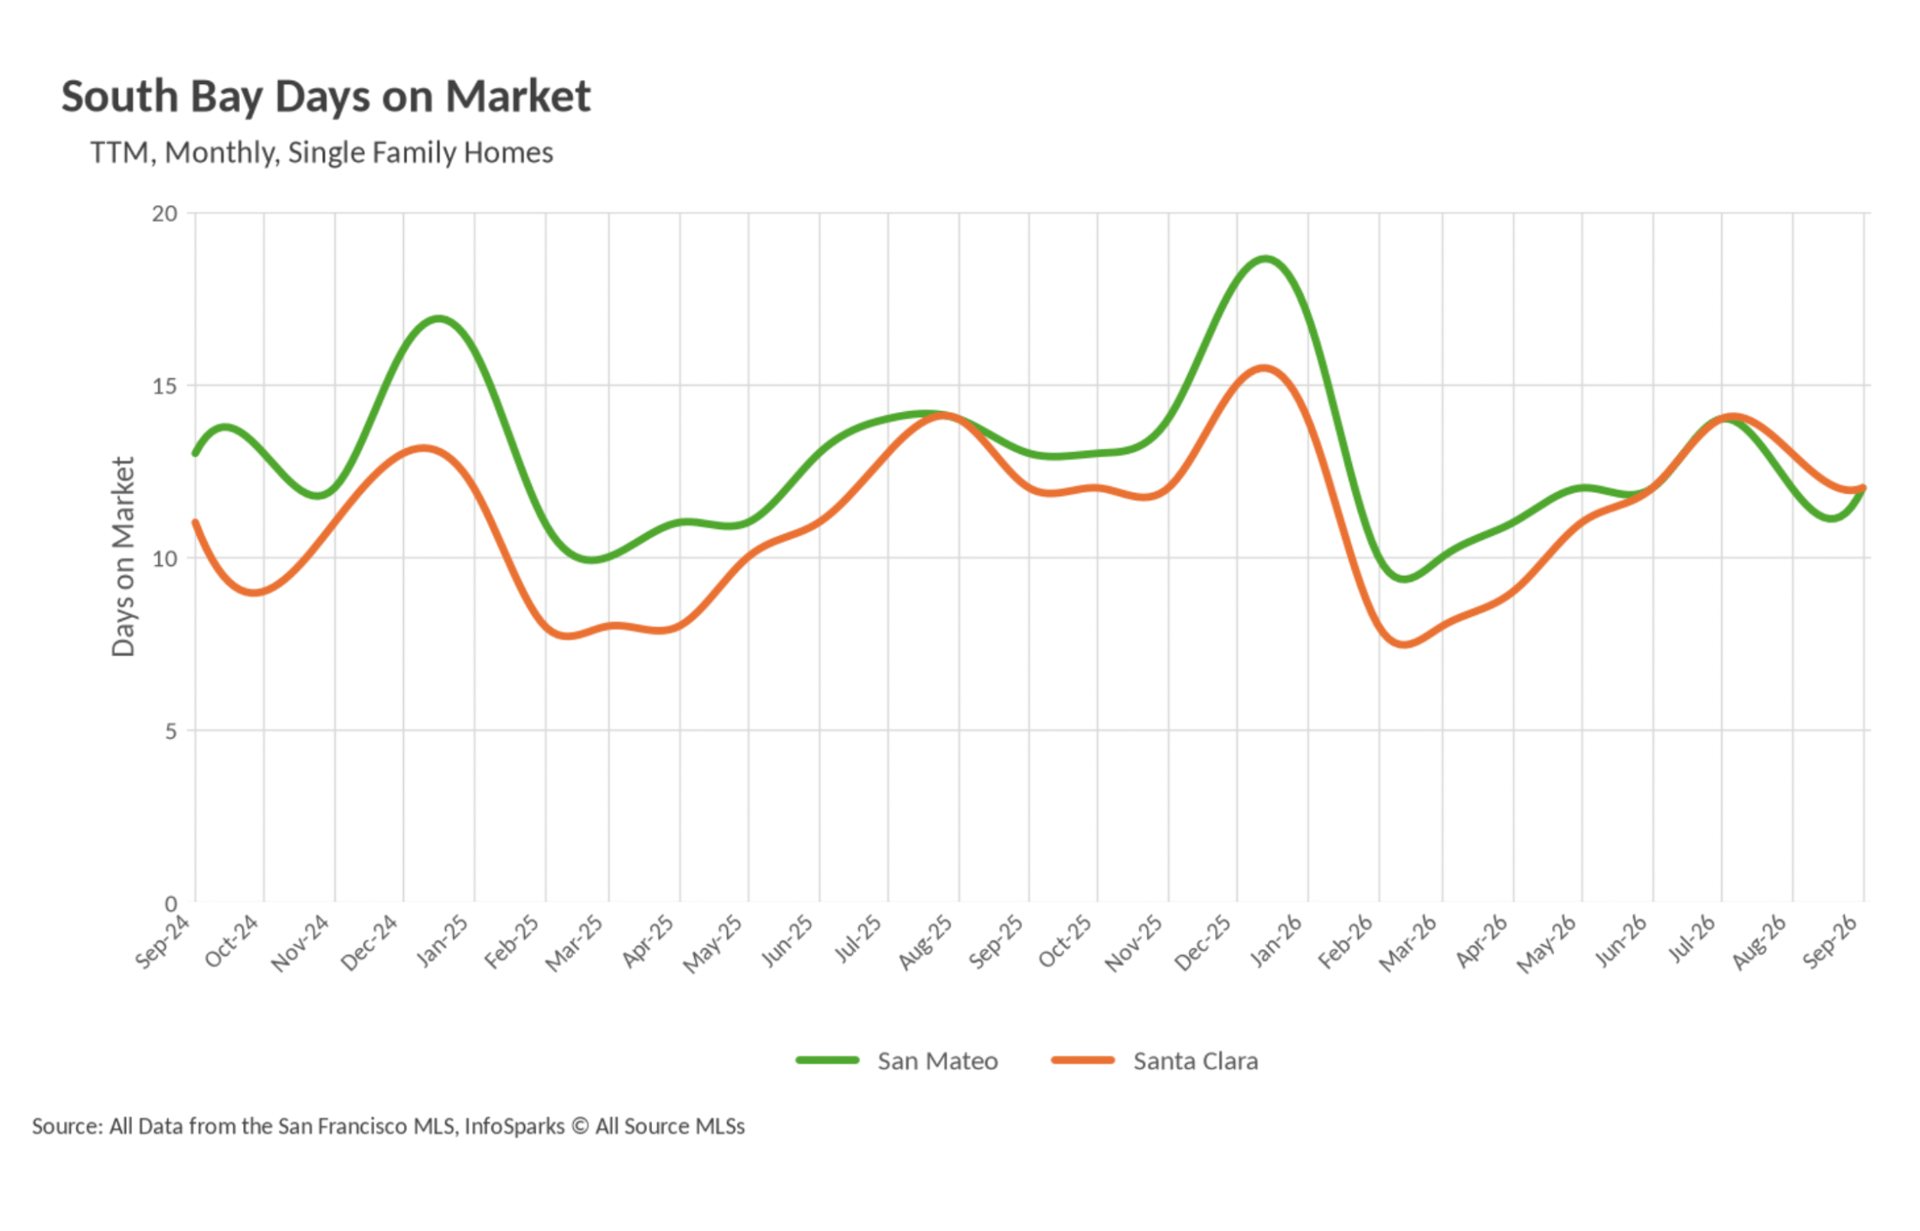
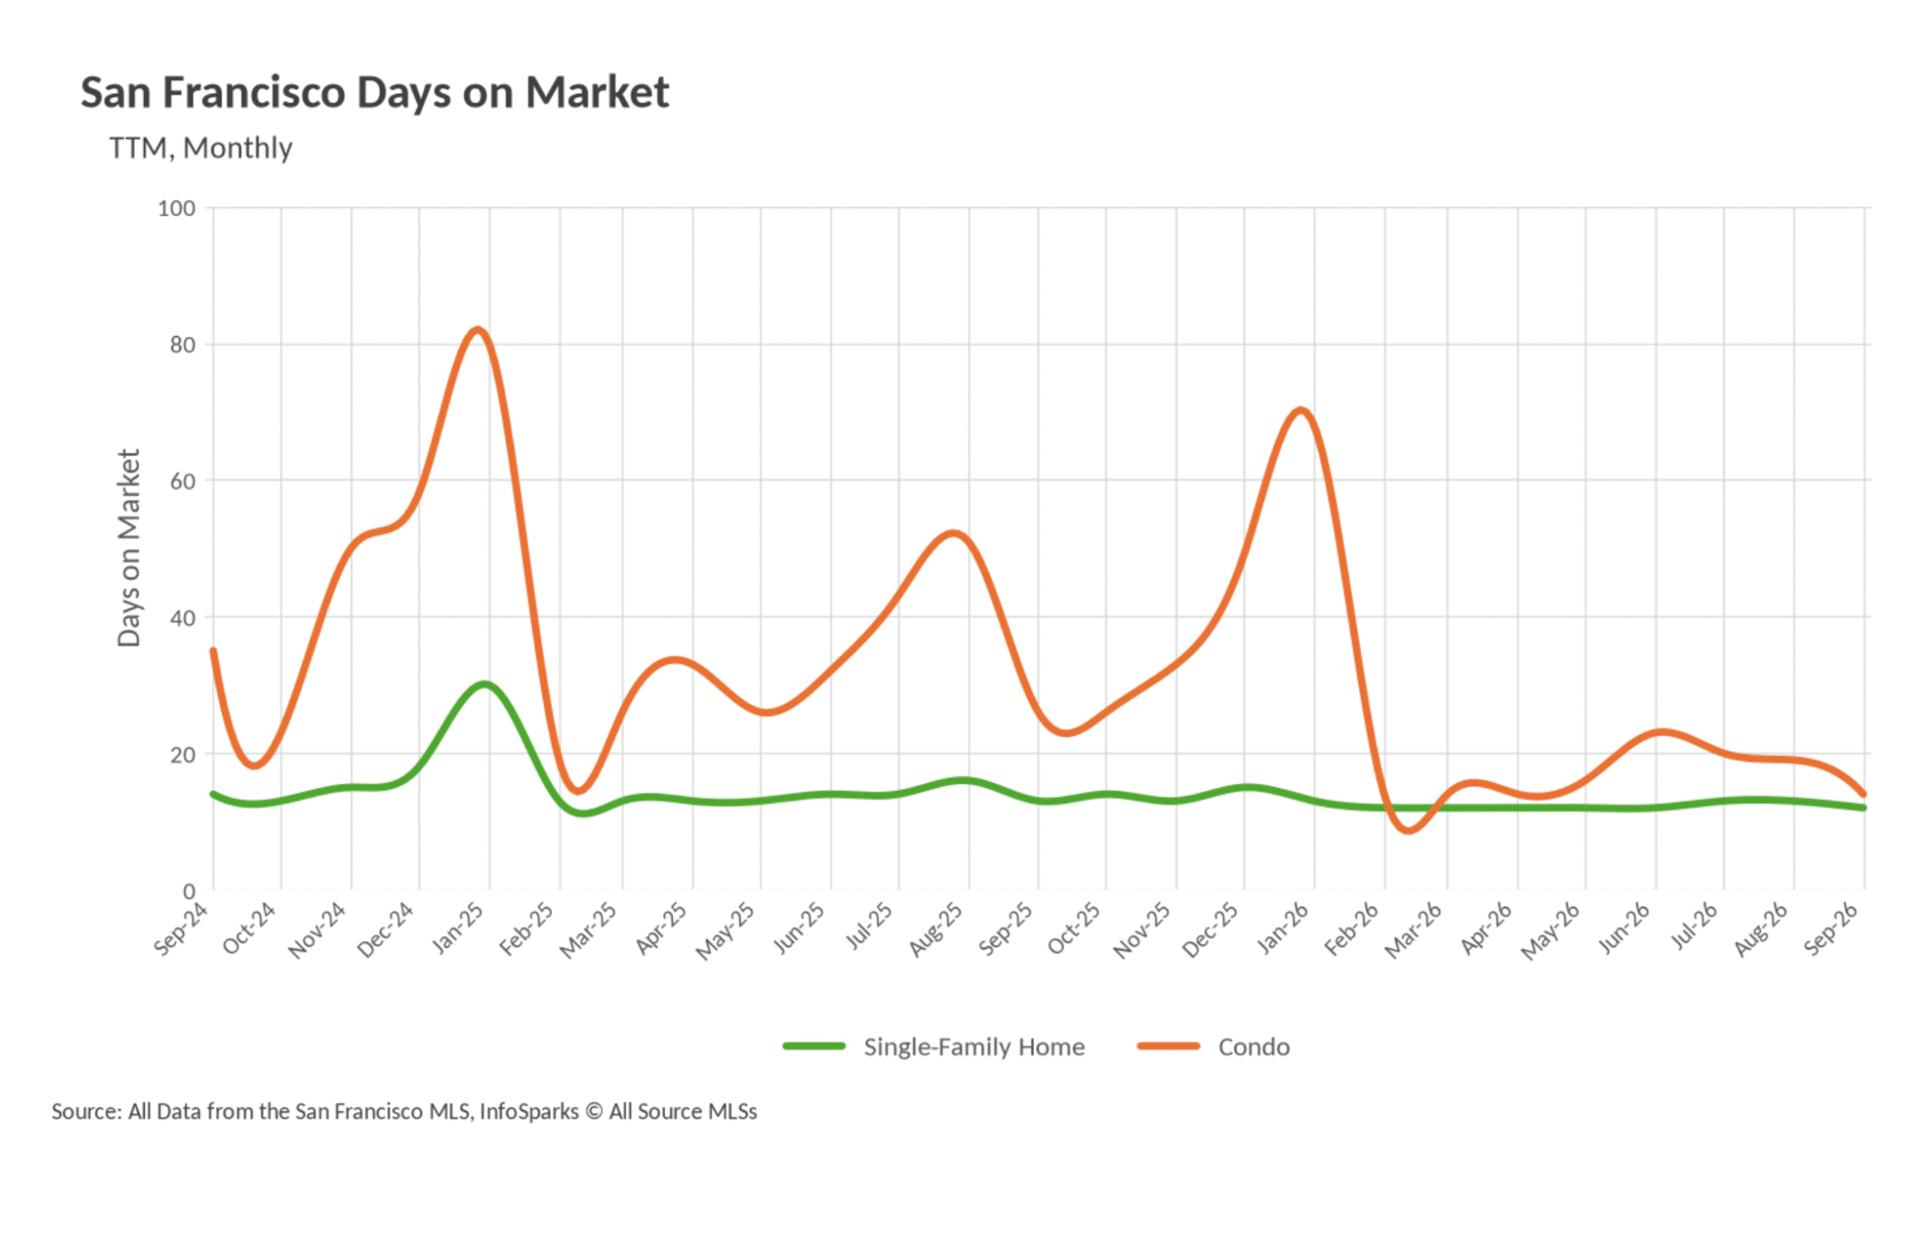
Transaction speed picked up almost everywhere. San Francisco, San Mateo, Santa Clara, Alameda, and Marin all turned over single-family homes in two weeks or less, while Napa roughly halved its average marketing time.
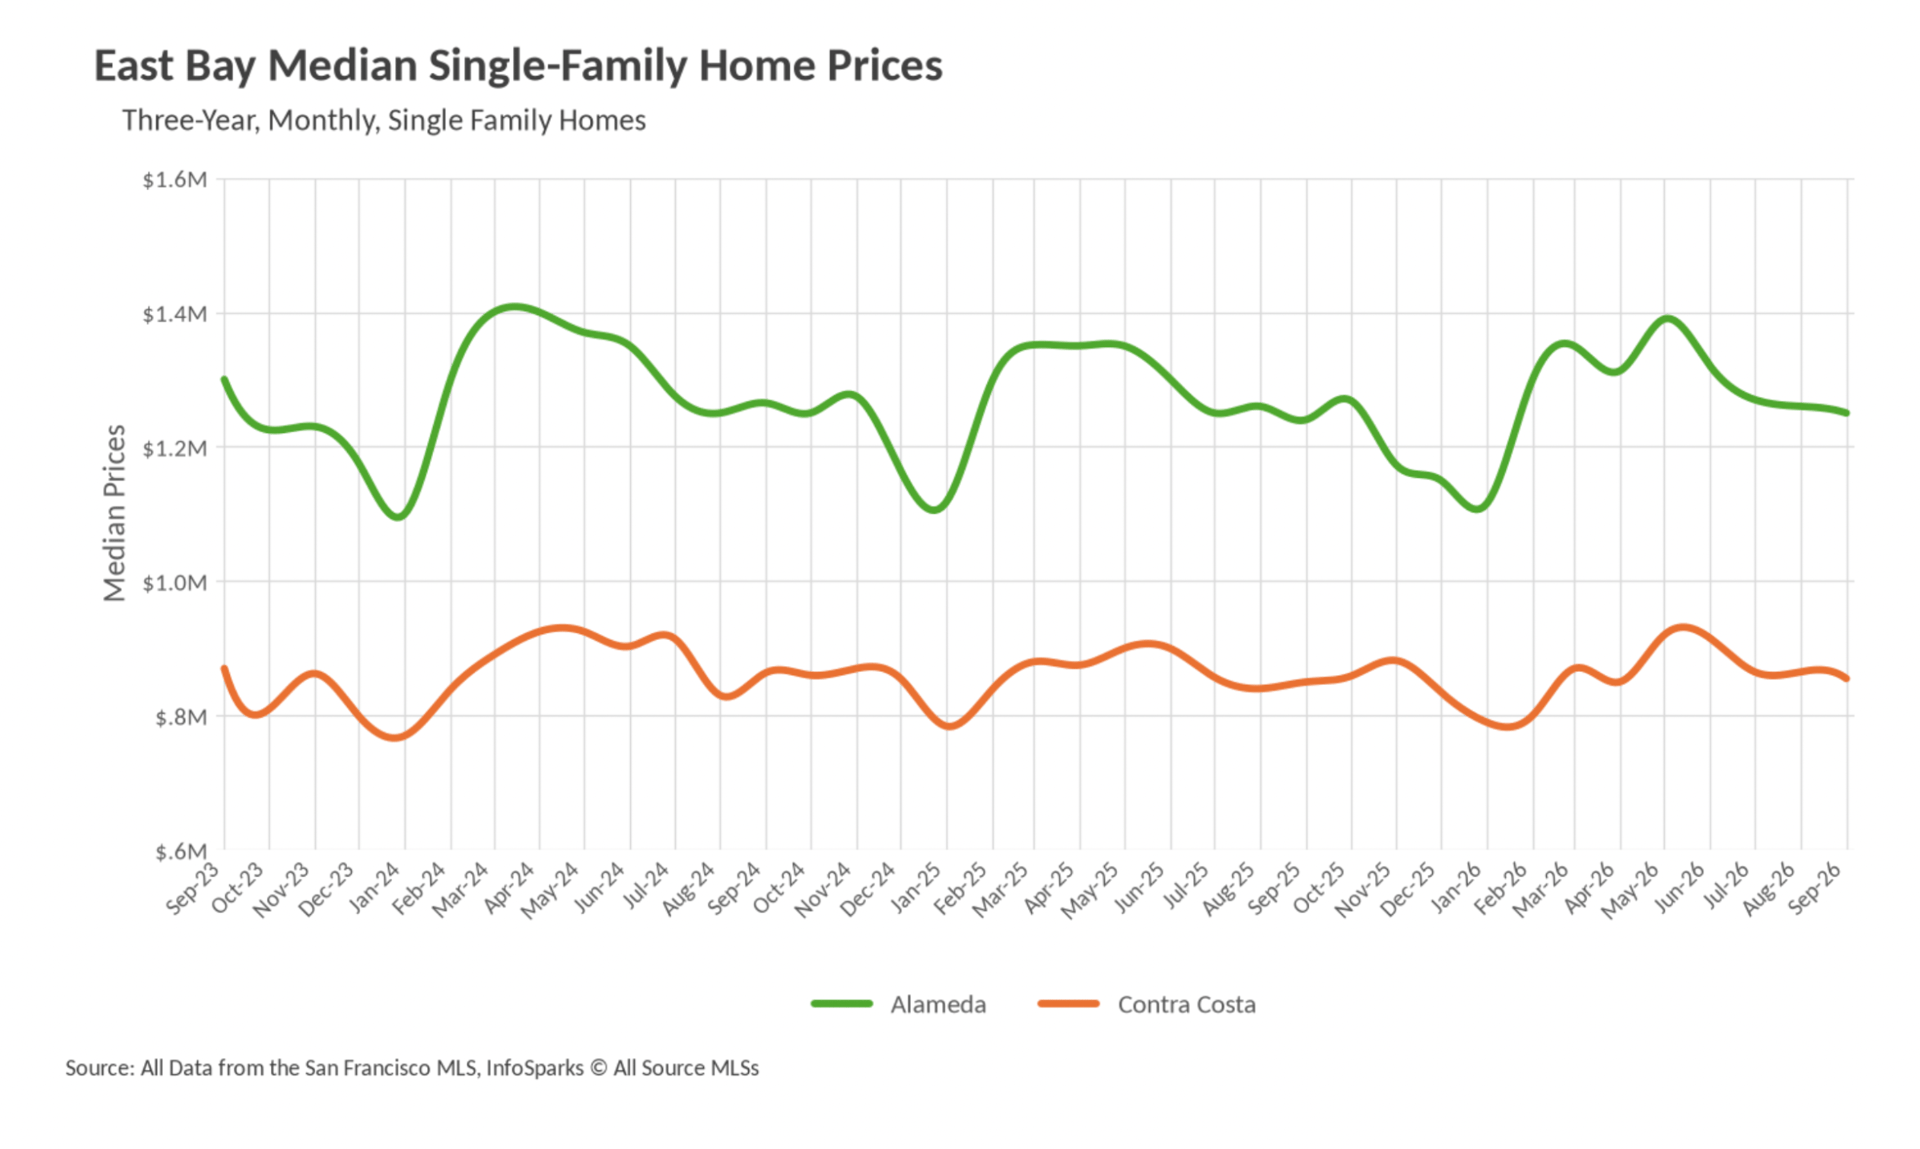
September's central theme is a widening gap between property types. Detached homes across the nine counties are still trading at or above year-ago levels, while attached homes outside San Francisco and Alameda County are absorbing most of the softness. San Francisco produced the sharpest single-family swing of the month, bouncing back from a weak August to a $2,054,000 median, an 11.03% gain from the prior month and 18.39% above last September. San Mateo County continues to anchor the top of the price ladder at $2,129,000, a 6.50% annual increase, and Sonoma County turned in the North Bay's best annual performance at $865,000, up 7.79% from a year ago and 9.08% from August. Marin County steadied at $1,750,000, Napa printed $918,000, and Santa Cruz County came in at $1,250,000, each slightly ahead of last year. The softer group is shorter: Santa Clara County eased 2.56% to $1,900,000, Alameda County was effectively flat at $1,250,000, Contra Costa County held at $850,500, and Solano County retreated 5.74% to $575,000.
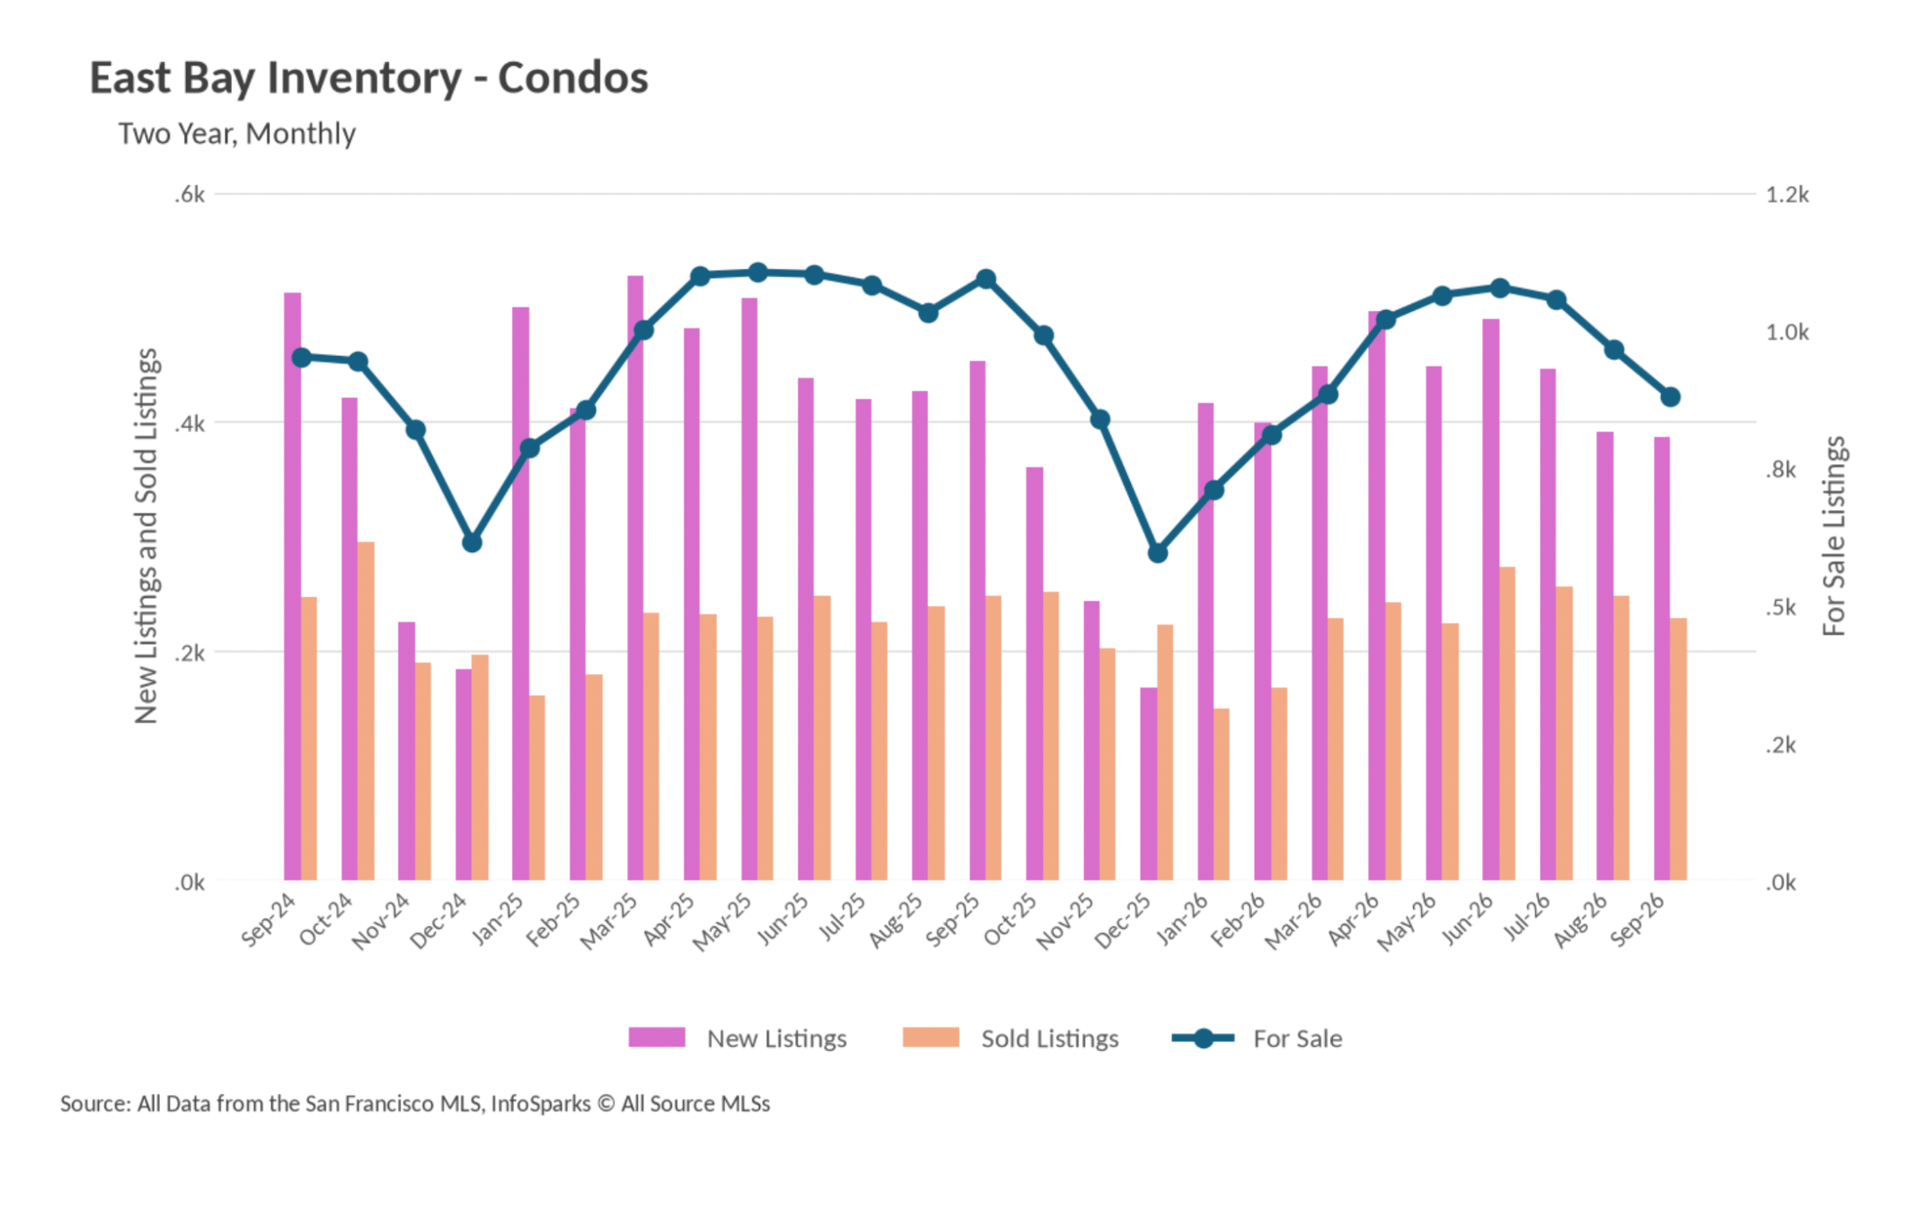
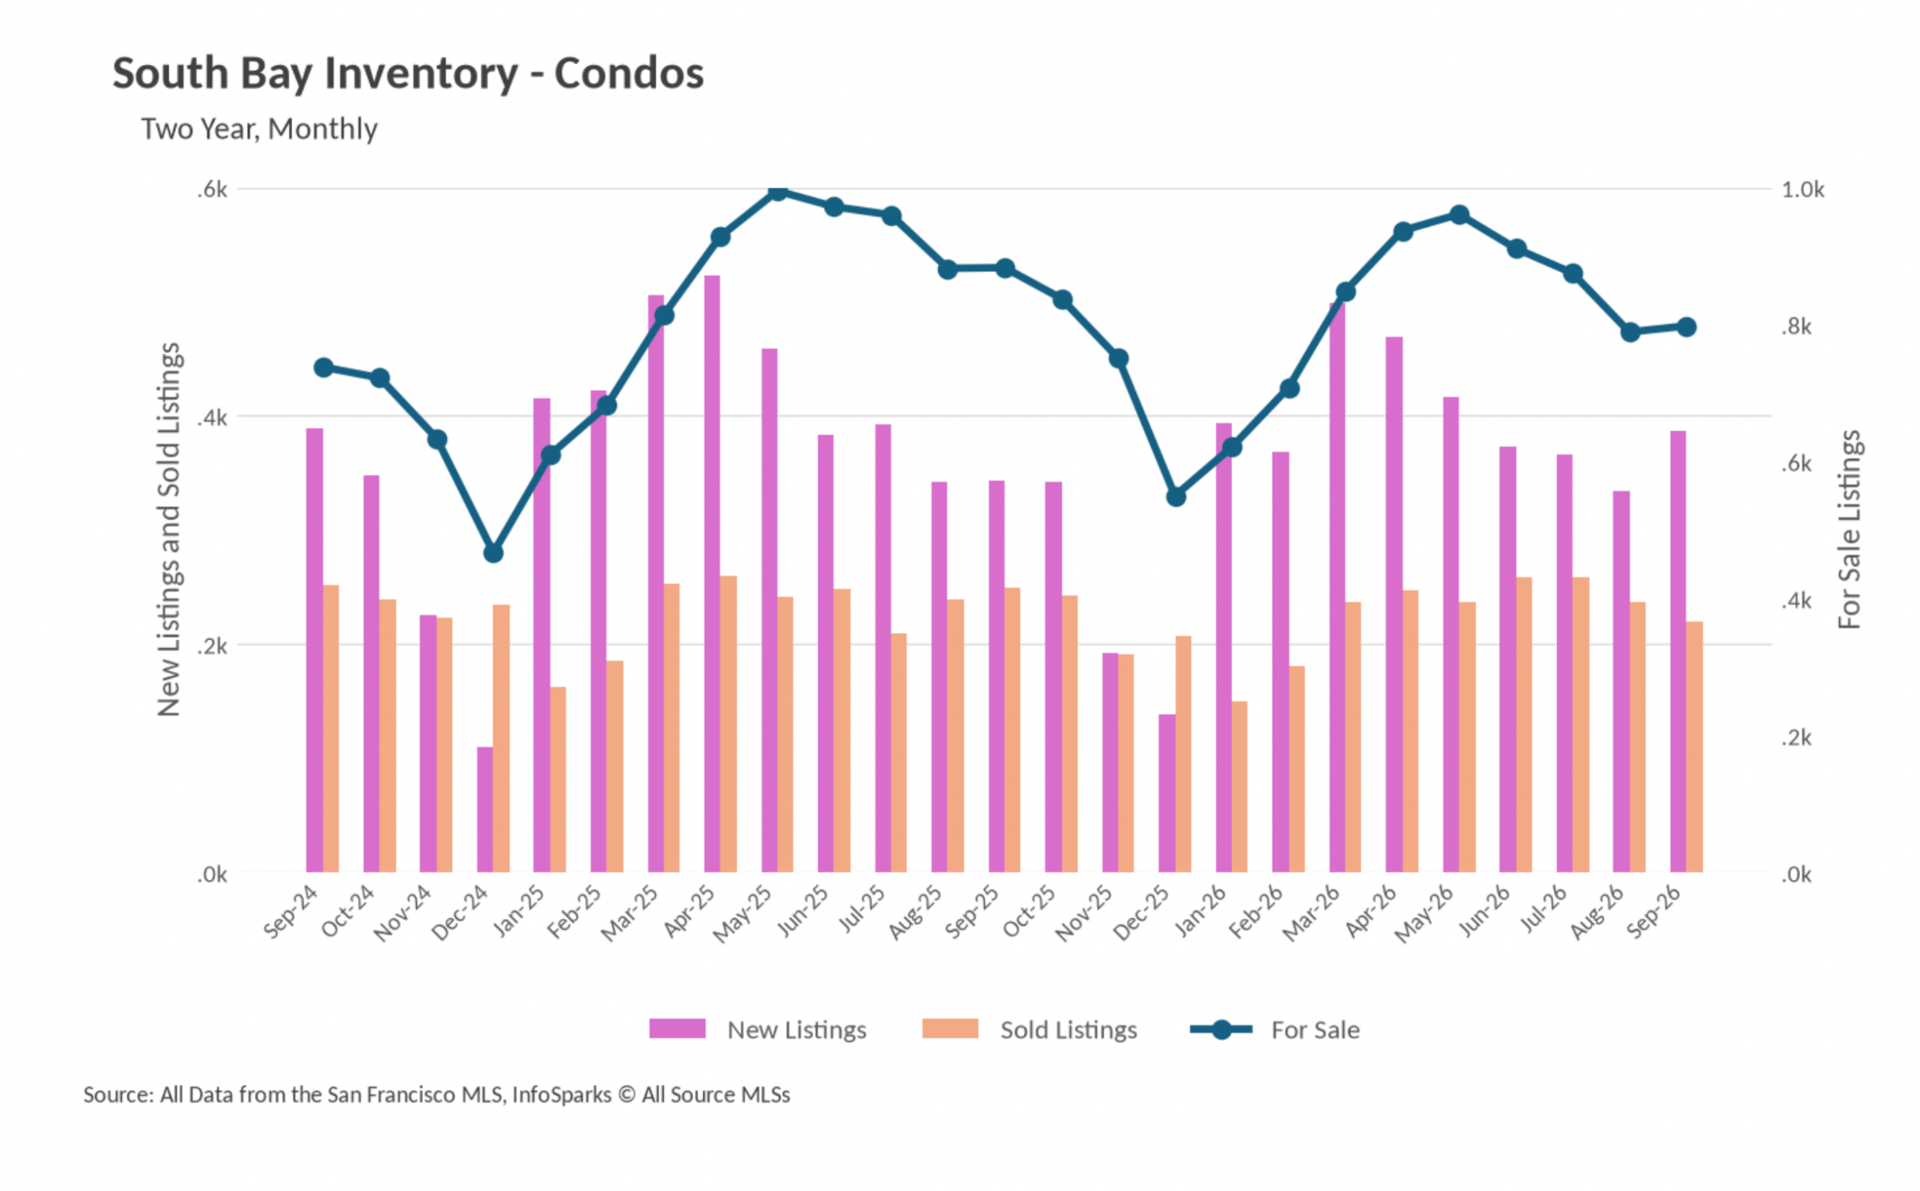
Condos tell a very different tale. San Francisco's attached median reached $1,316,500, a third straight monthly advance and an 18.87% climb from last September, and Alameda County added 2.28% to land at $560,000. Beyond those two, the arrows point down. Santa Cruz County condos dropped 20.95% to $585,000, Napa County fell 17.54% to $705,000, and Santa Clara County gave back 17.05% to $627,500, the weakest figure in three years of records. More moderate pullbacks appeared in Contra Costa (down 5.42% to $480,000), Marin (down 4.88% to $575,000), San Mateo (down 3.77% to $740,000), Solano (down 3.13% to $341,000), and Sonoma (down 1.49% to $497,500). Taken together, this is less a cooling market than a selective one, where buyers are stretching for detached homes and for the urban core while driving hard bargains almost everywhere else.
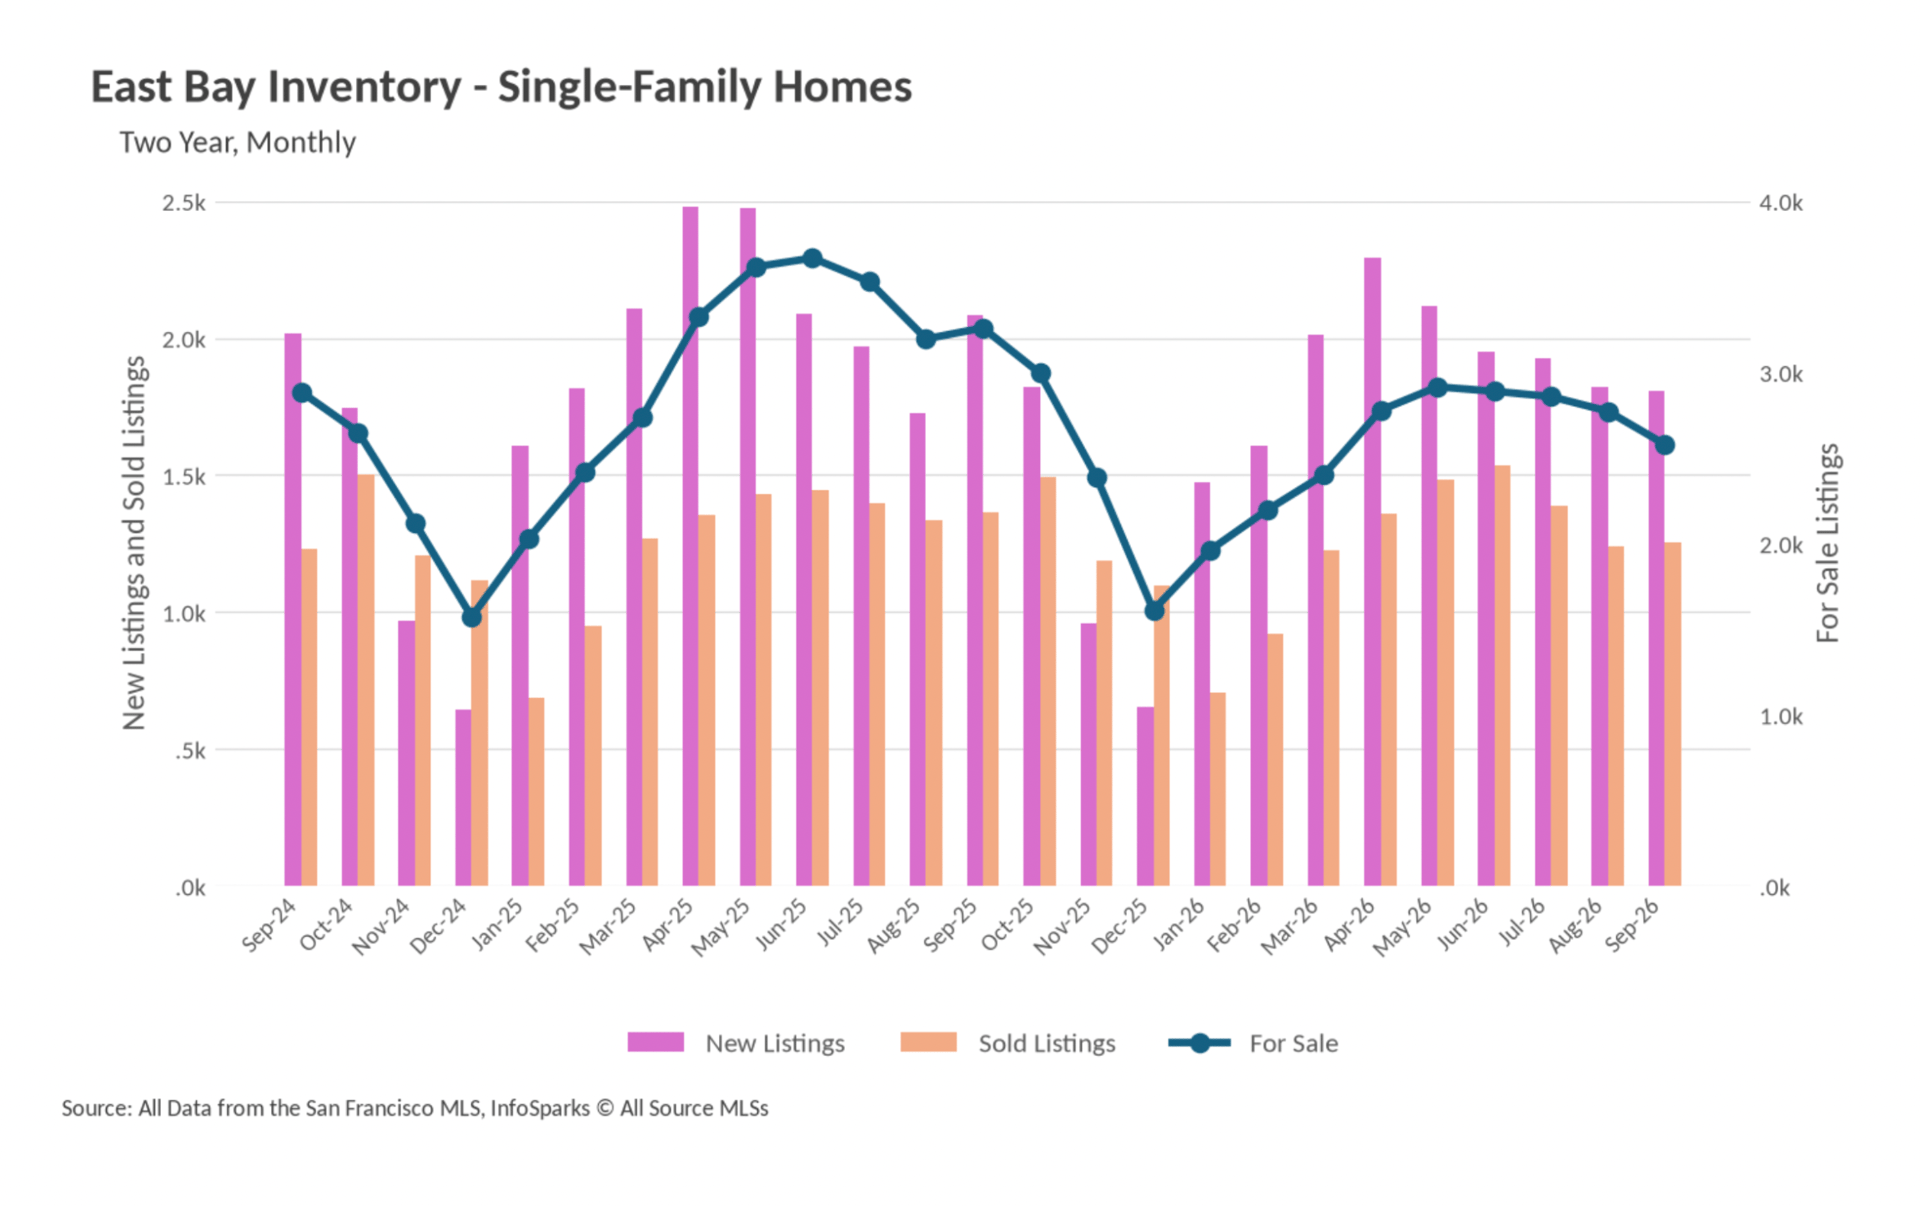
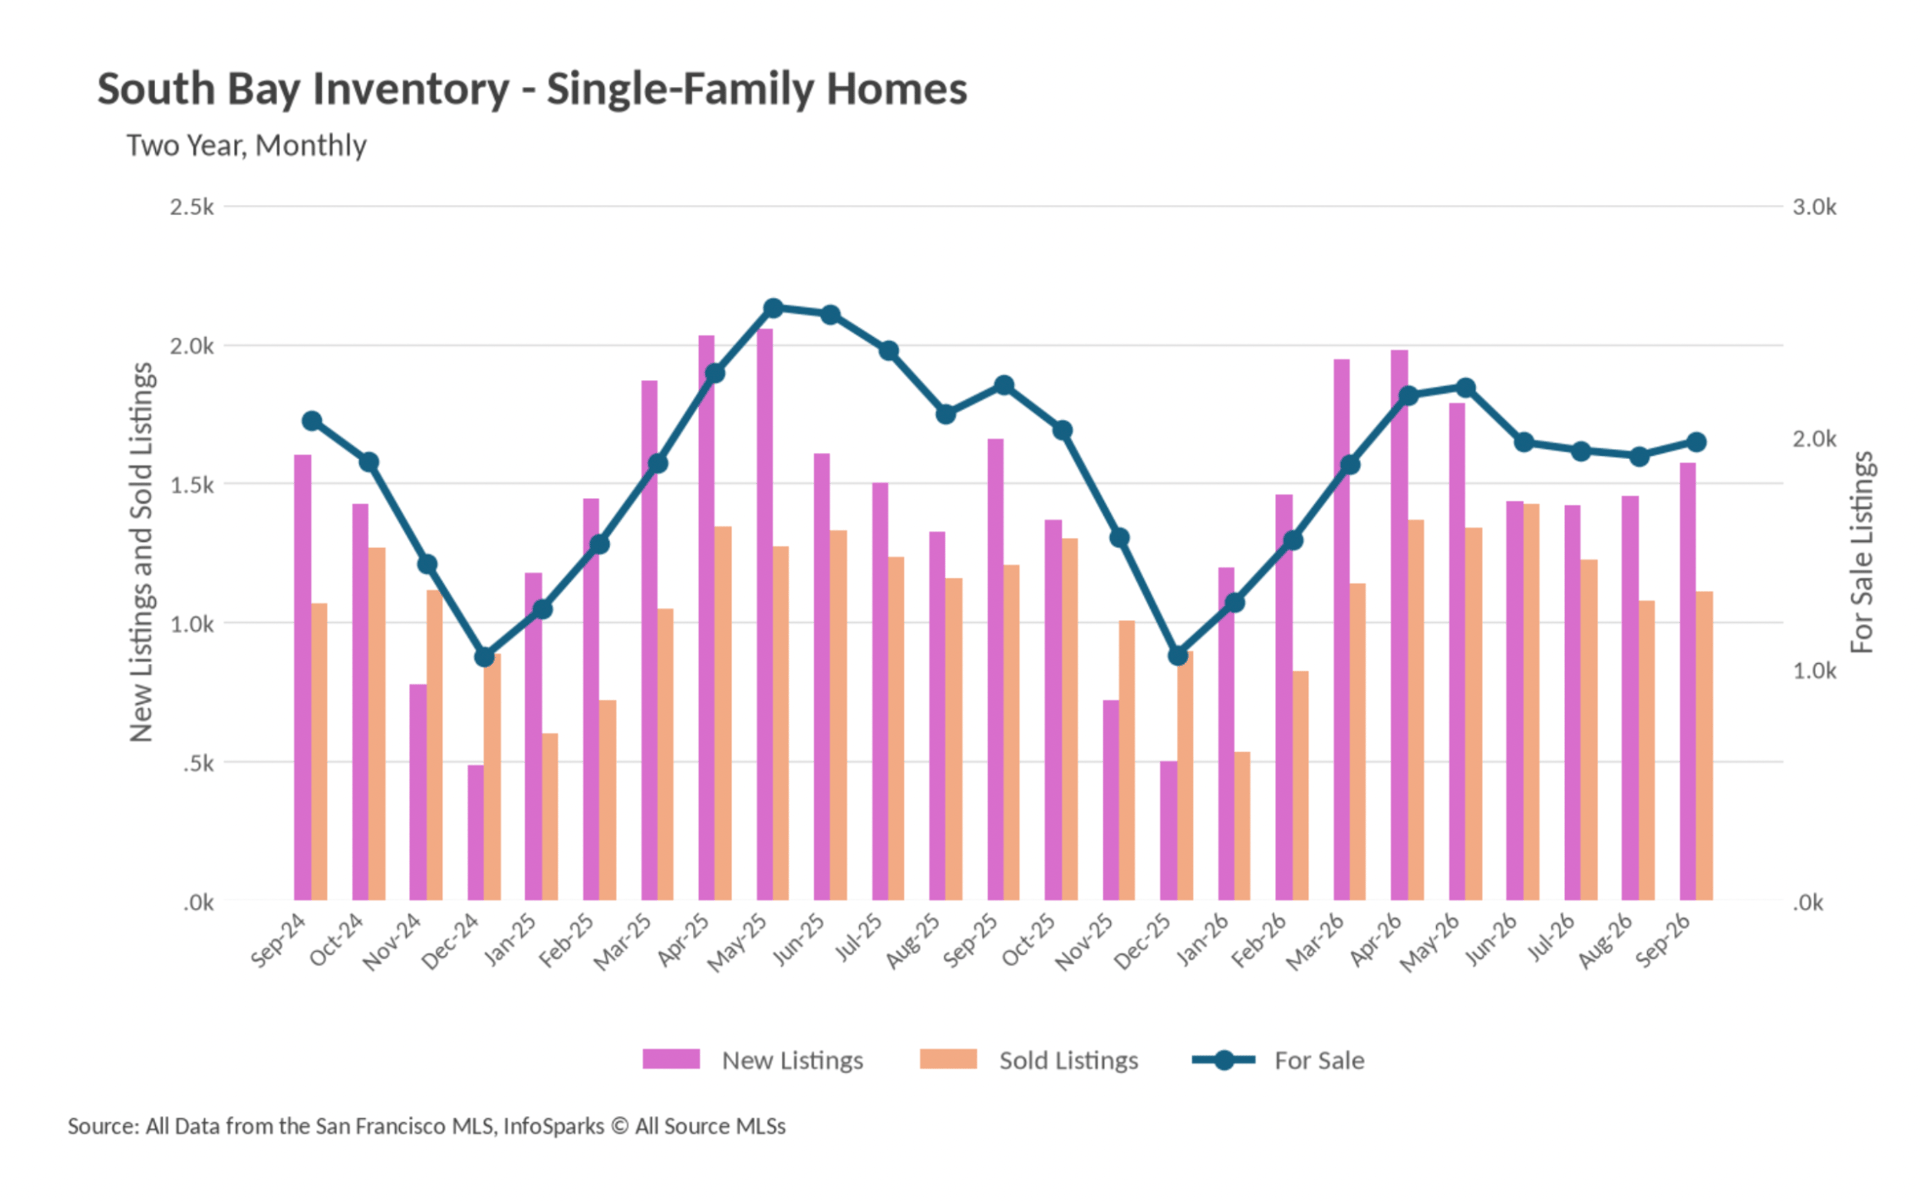
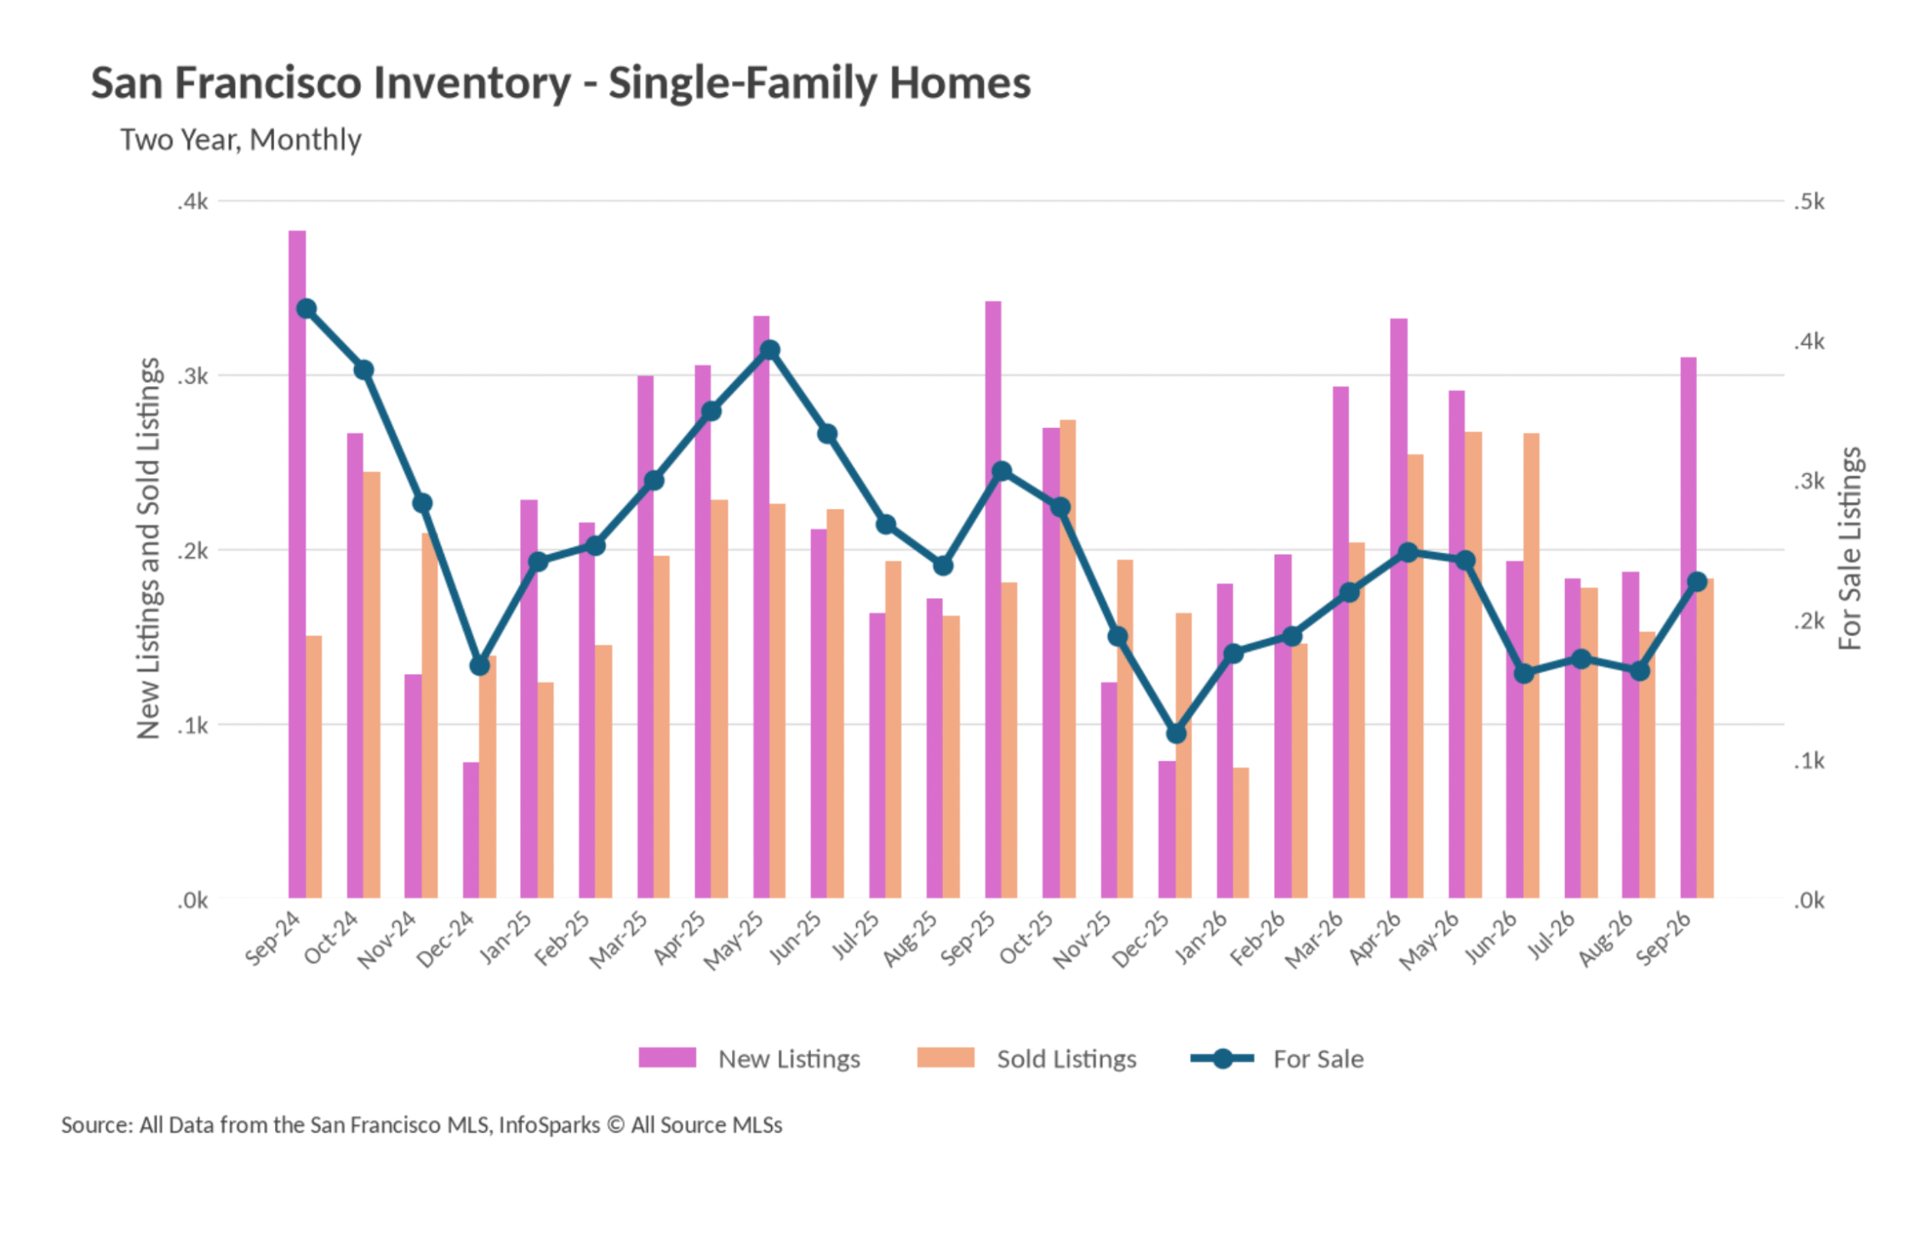
If a single figure captures September, it is the listing count. Available single-family homes dropped in every subregion. The North Bay led the contraction with 2,803 units, down 28.15% from 3,901 a year ago and nearly 15% below August. San Francisco's 229 active listings were 25.16% lighter than last year even after a healthy seasonal rebound from August's 164. The East Bay showed 2,648 single-family listings, an 18.75% annual decline, while Silicon Valley's 2,007 listings were off 9.72%. Summed up, the region put roughly 2,000 fewer detached homes in front of buyers than it did twelve months ago.
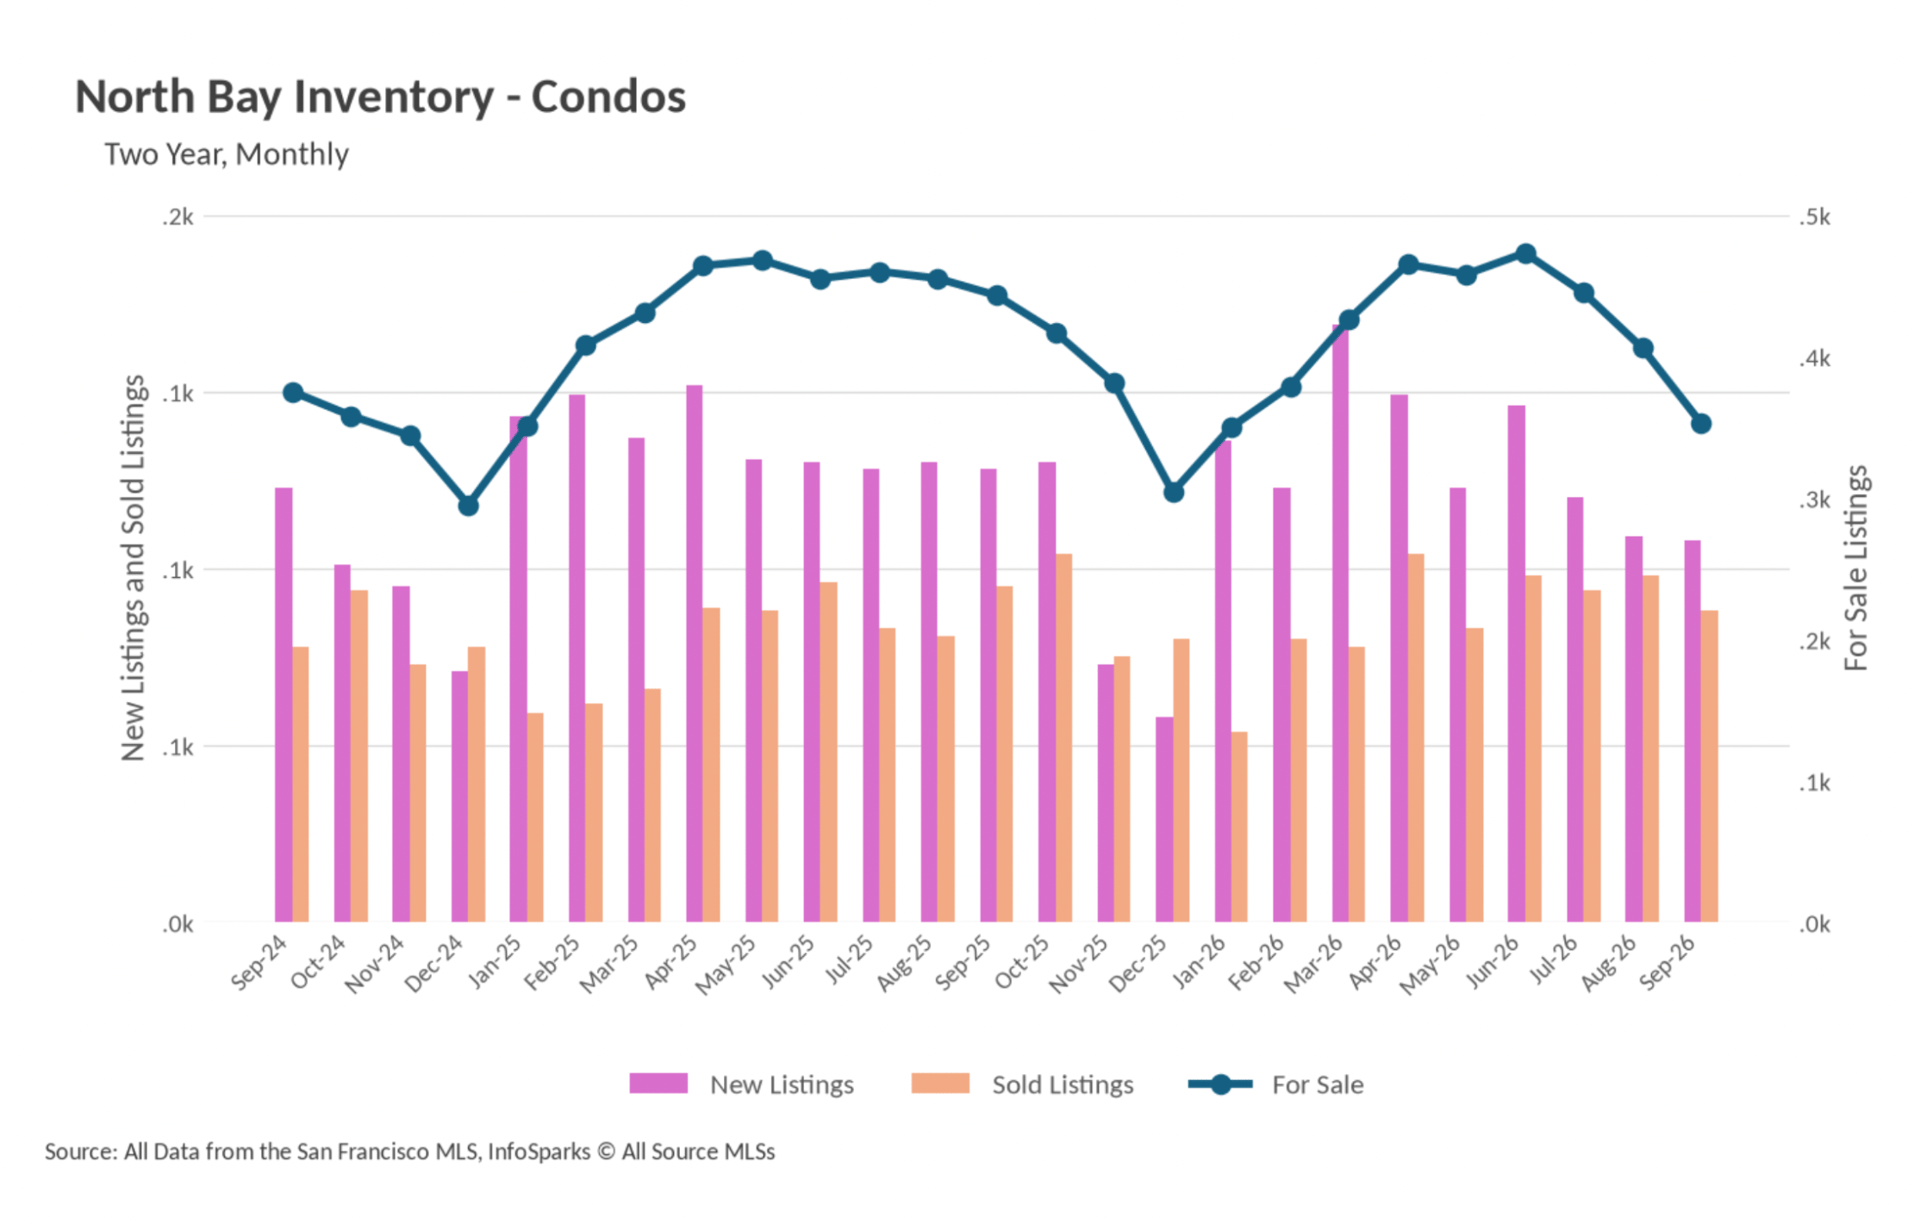
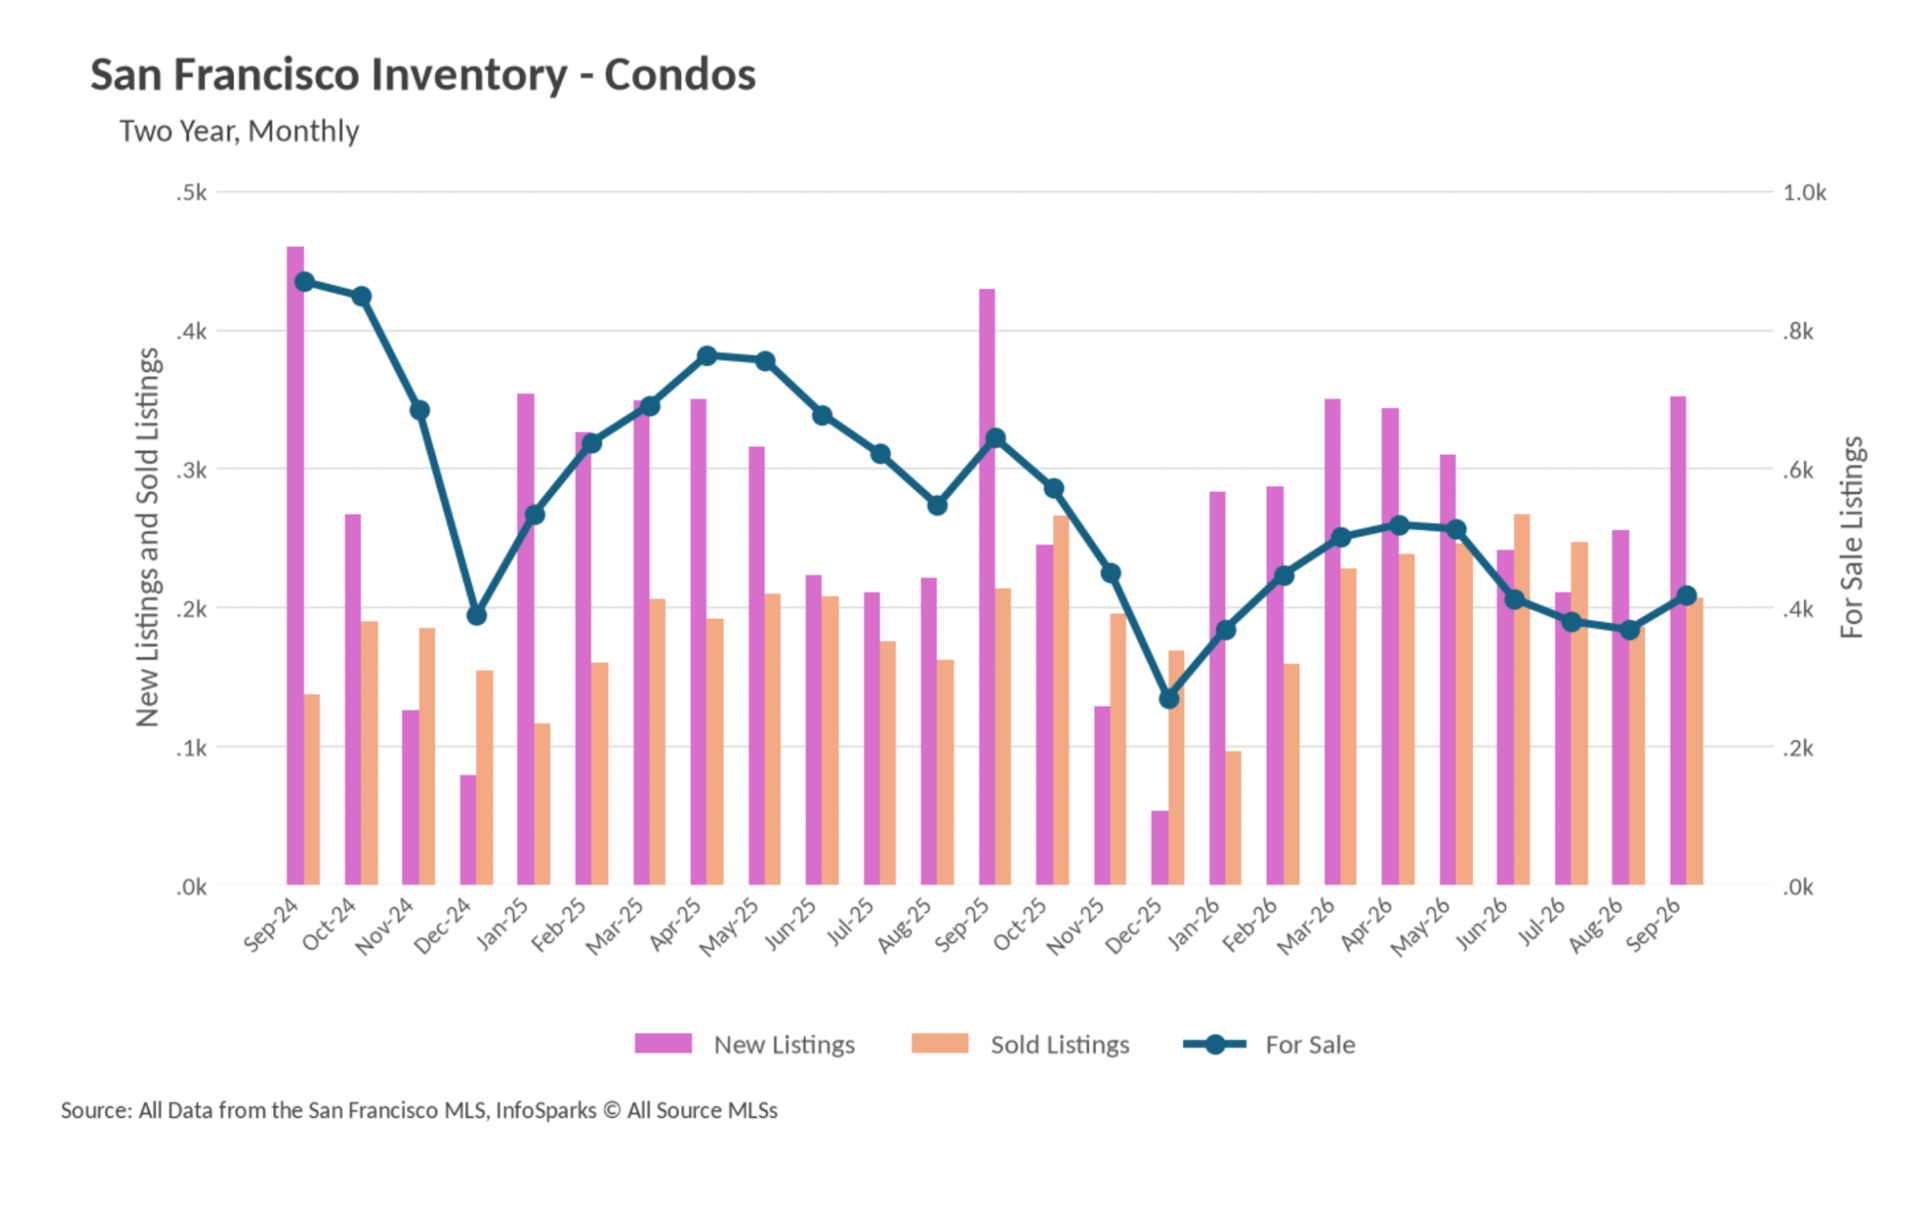
Attached inventory moved in lockstep. San Francisco recorded the sharpest decline at 428 units, down 33.54% from 644, with the East Bay off 18.36% to 894, the North Bay down 13.54% to 383, and Silicon Valley down 8.49% to 808. What stands out is the source of the squeeze: it is a seller shortage rather than a buyer surge. New single-family listings fell 24.05% in the North Bay, 12.06% in the East Bay, 9.65% in San Francisco, and 4.88% in Silicon Valley, while closings barely budged, down only 4.96% in the North Bay, 6.67% in the East Bay, 7.13% in Silicon Valley, and roughly flat in San Francisco at 184 versus 181. Pricing tends to hold when new supply shrinks faster than demand, and the September medians bear that out. Buyers can take some comfort in the fact that the usual fall restock did materialize, with active counts climbing month over month in both San Francisco and Silicon Valley and new listing activity improving in both.
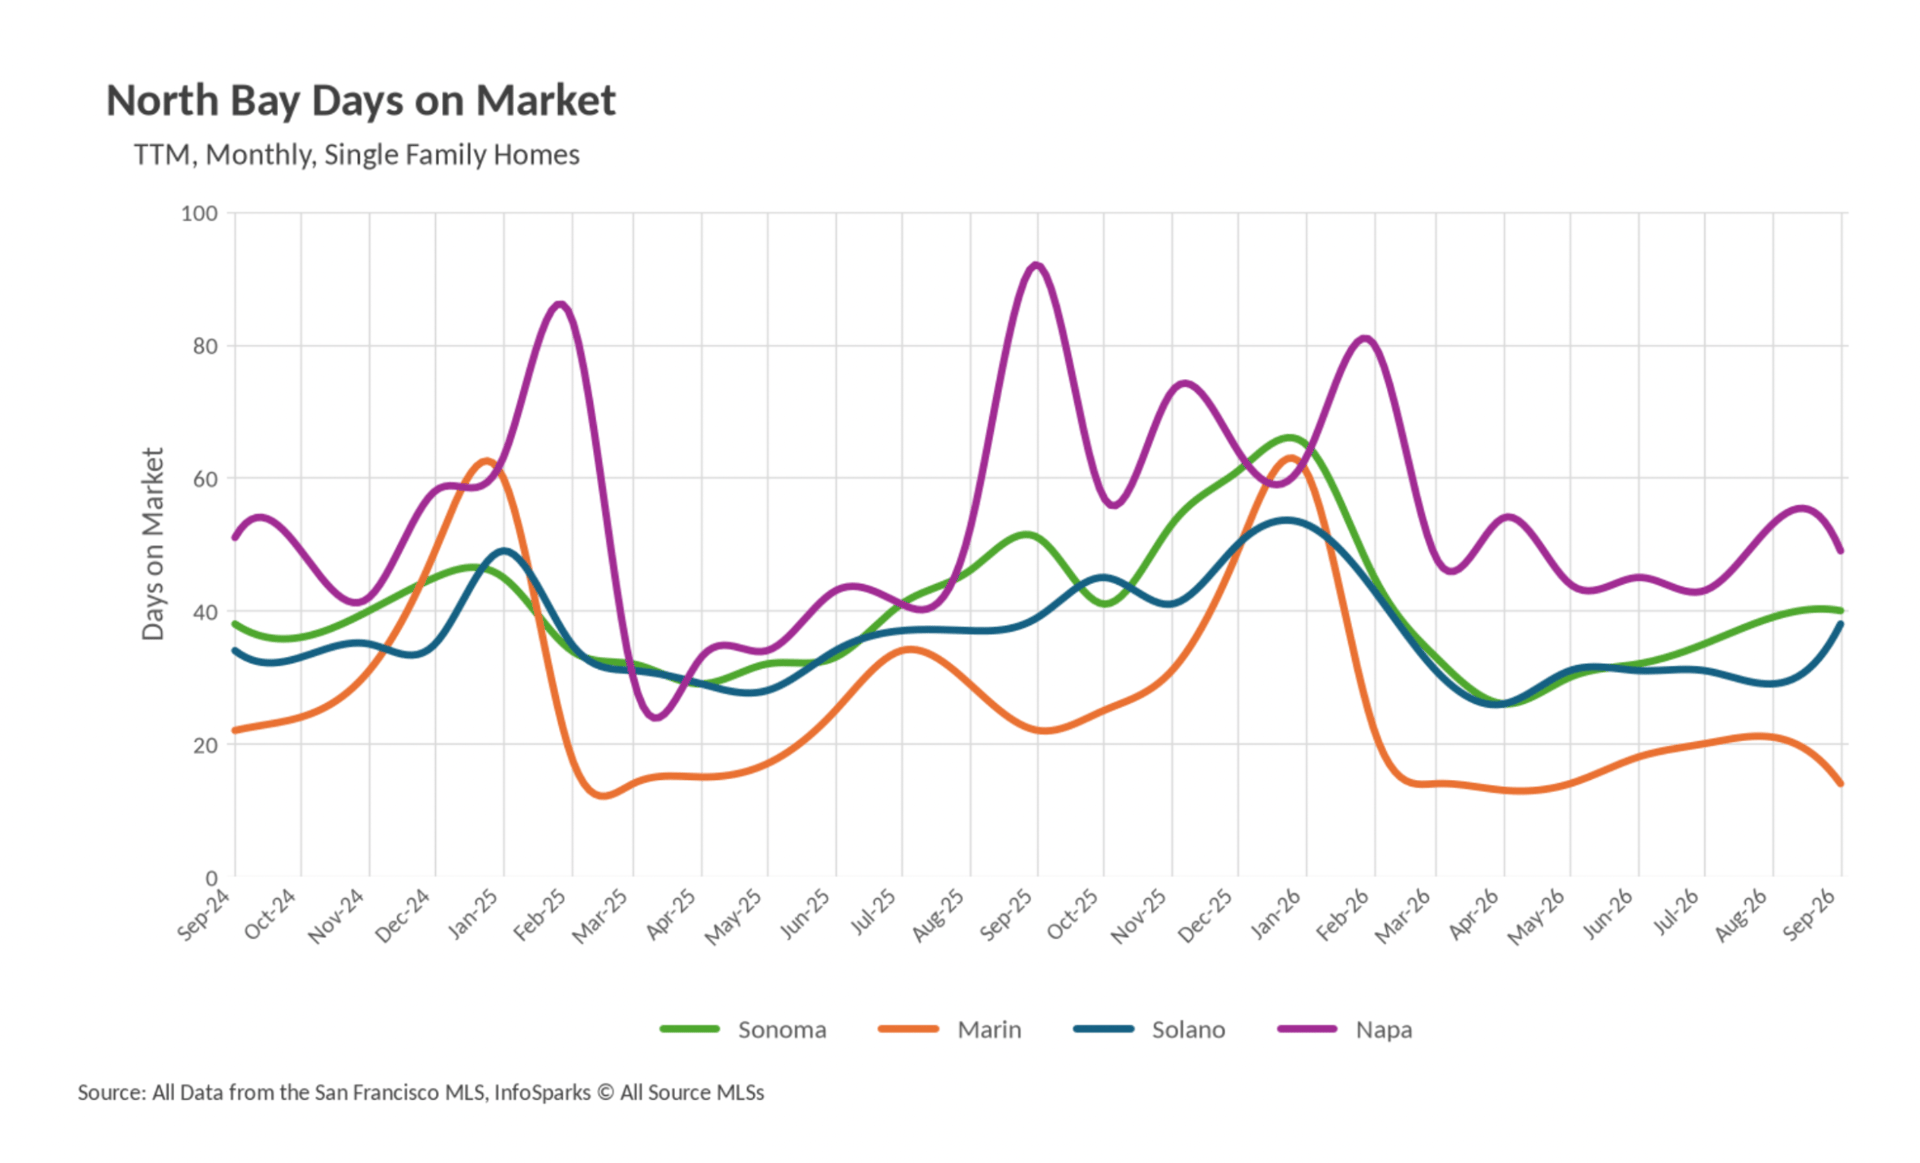
Marketing periods compressed nearly across the board. San Francisco, San Mateo County, and Santa Clara County each averaged 12 days for detached homes, Alameda County registered 13 days, and Marin County landed at 14 days, a 36.36% improvement over last September and Marin's quickest pace in two years. Contra Costa County trailed at 19 days, itself 17.39% faster than a year ago. The longer timelines belong to the markets you would anticipate given location and price: Santa Cruz County at 29 days, Solano at 38, Sonoma at 39, and Napa at 48. Napa's number, however, is the region's biggest single improvement, down 47.83% from 92 days last September.
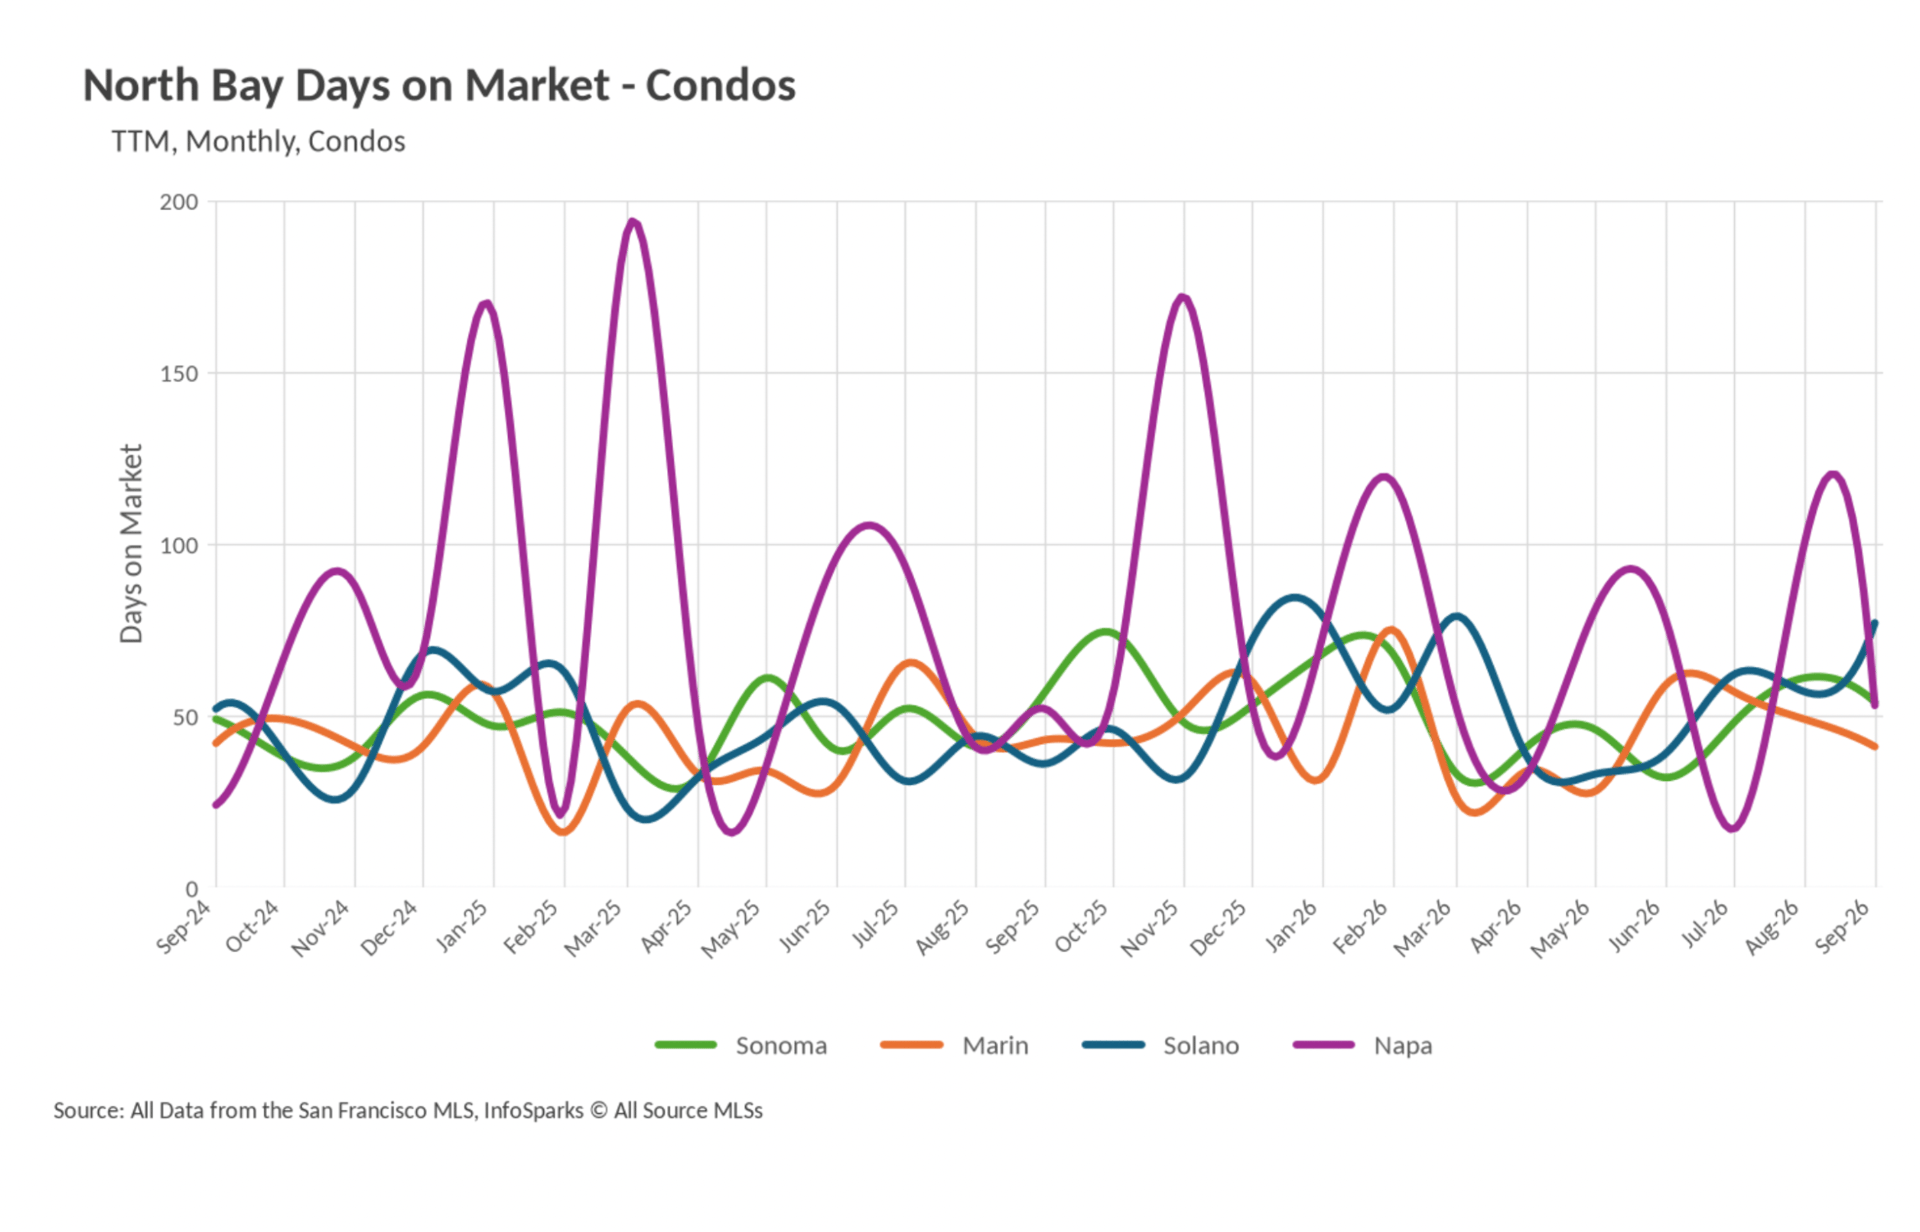
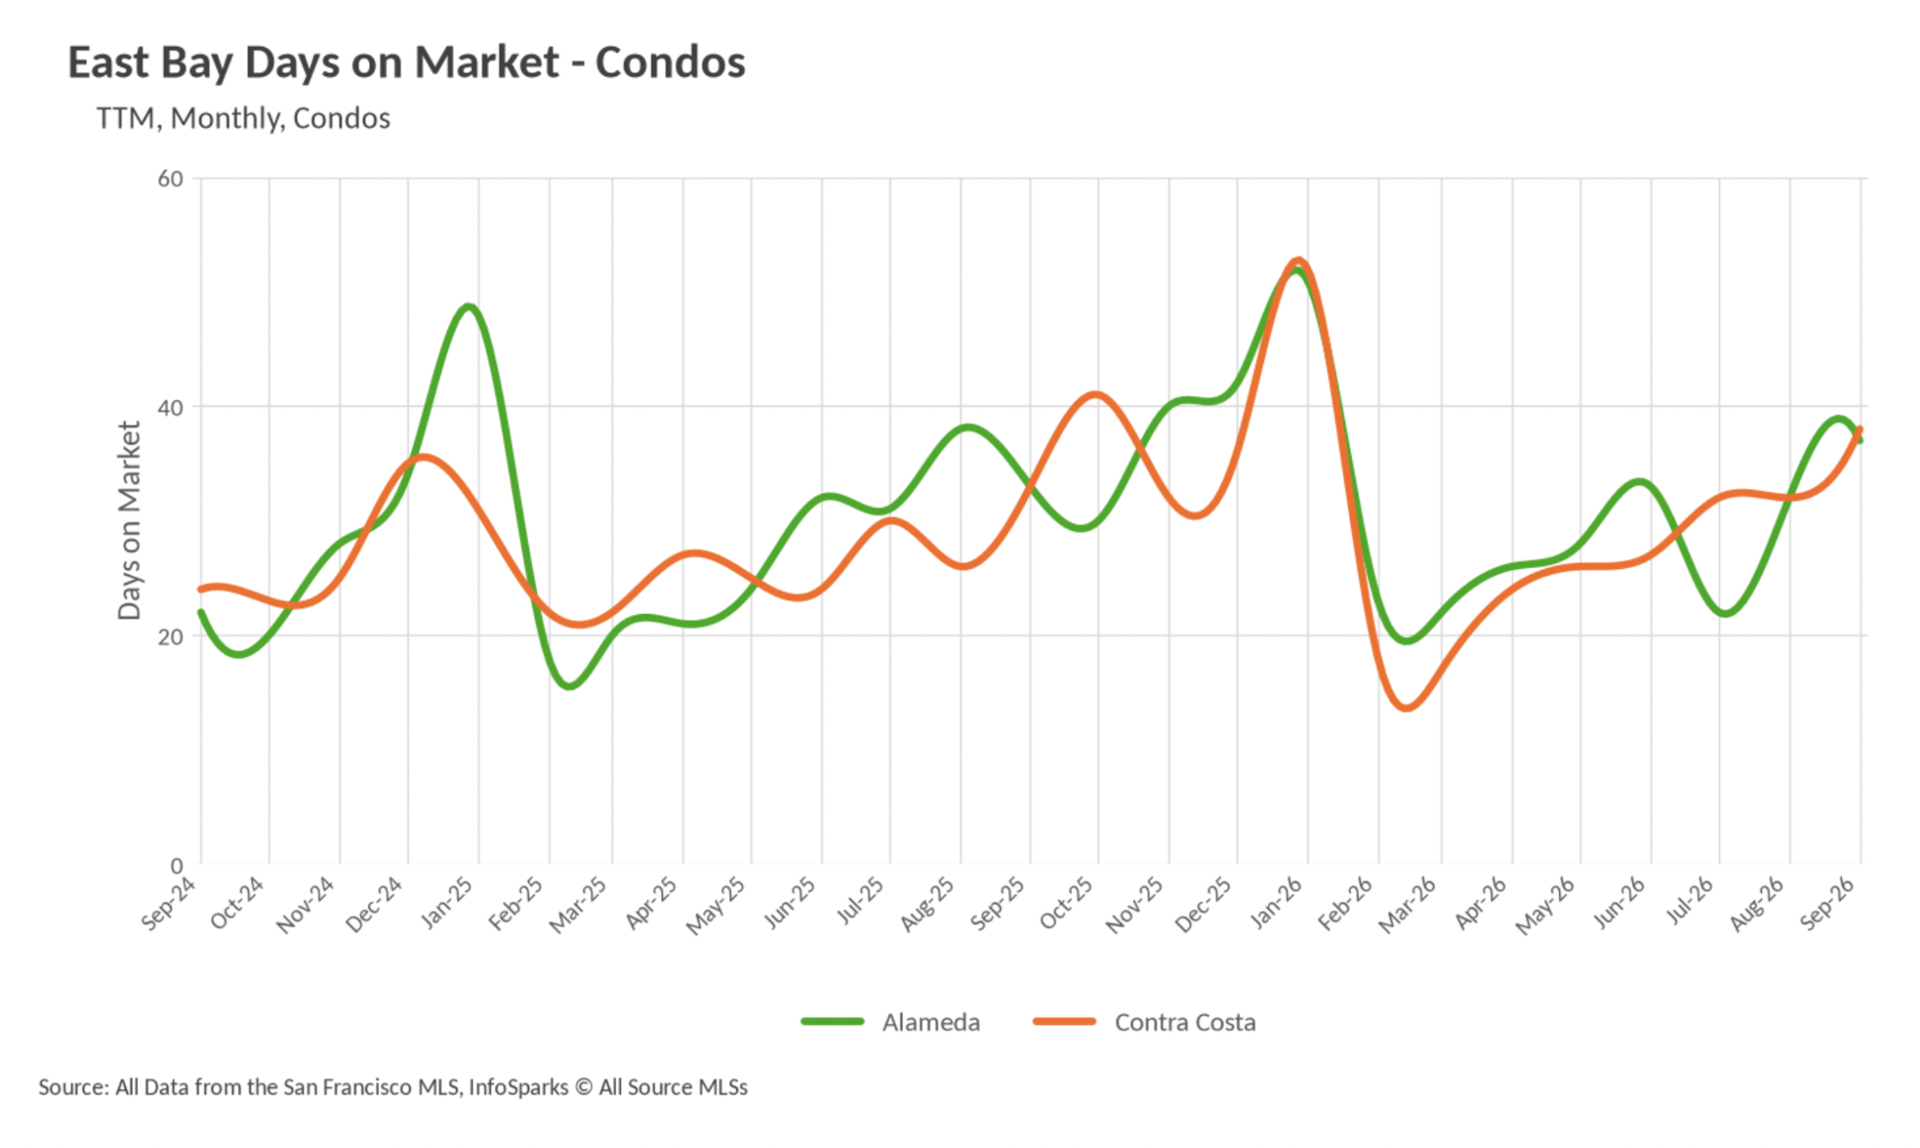
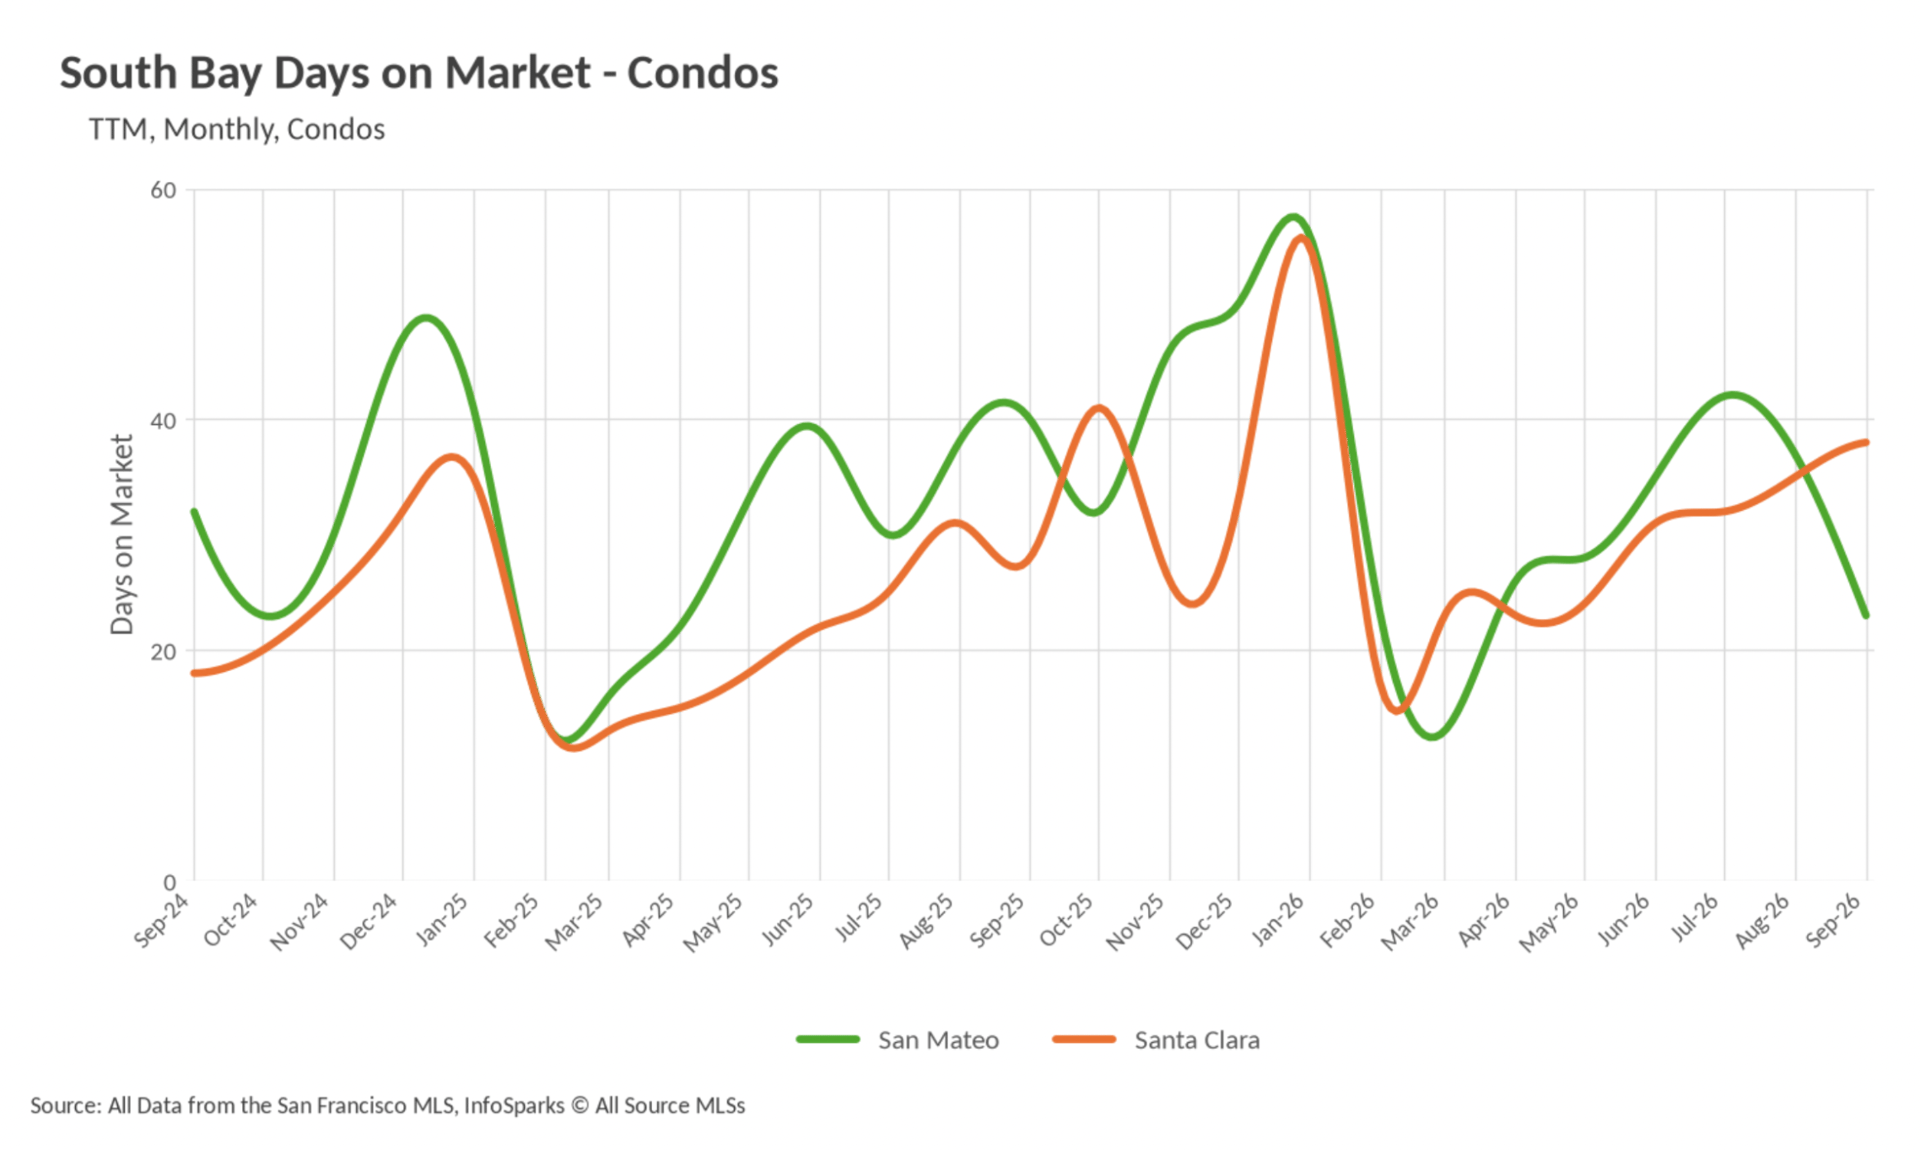
Condo timelines are far less uniform, and they track the pricing narrative closely. San Francisco condos averaged 14 days, a 46.15% improvement from 26 days a year earlier and among the fastest marks that market has ever recorded, effectively matching detached homes. San Mateo County condos improved 37.50% to 25 days. After that the clock slows: Contra Costa at 36 days, Alameda at 37 (12.12% longer than last year), Santa Clara at 38 (up 35.71%), Santa Cruz at 39, Marin at 41, Napa at 53, Sonoma at 54, and Solano at 77 days, more than twice last September's 36. Anyone shopping for attached housing outside the city still enjoys a deliberation window that detached-home buyers have lost.
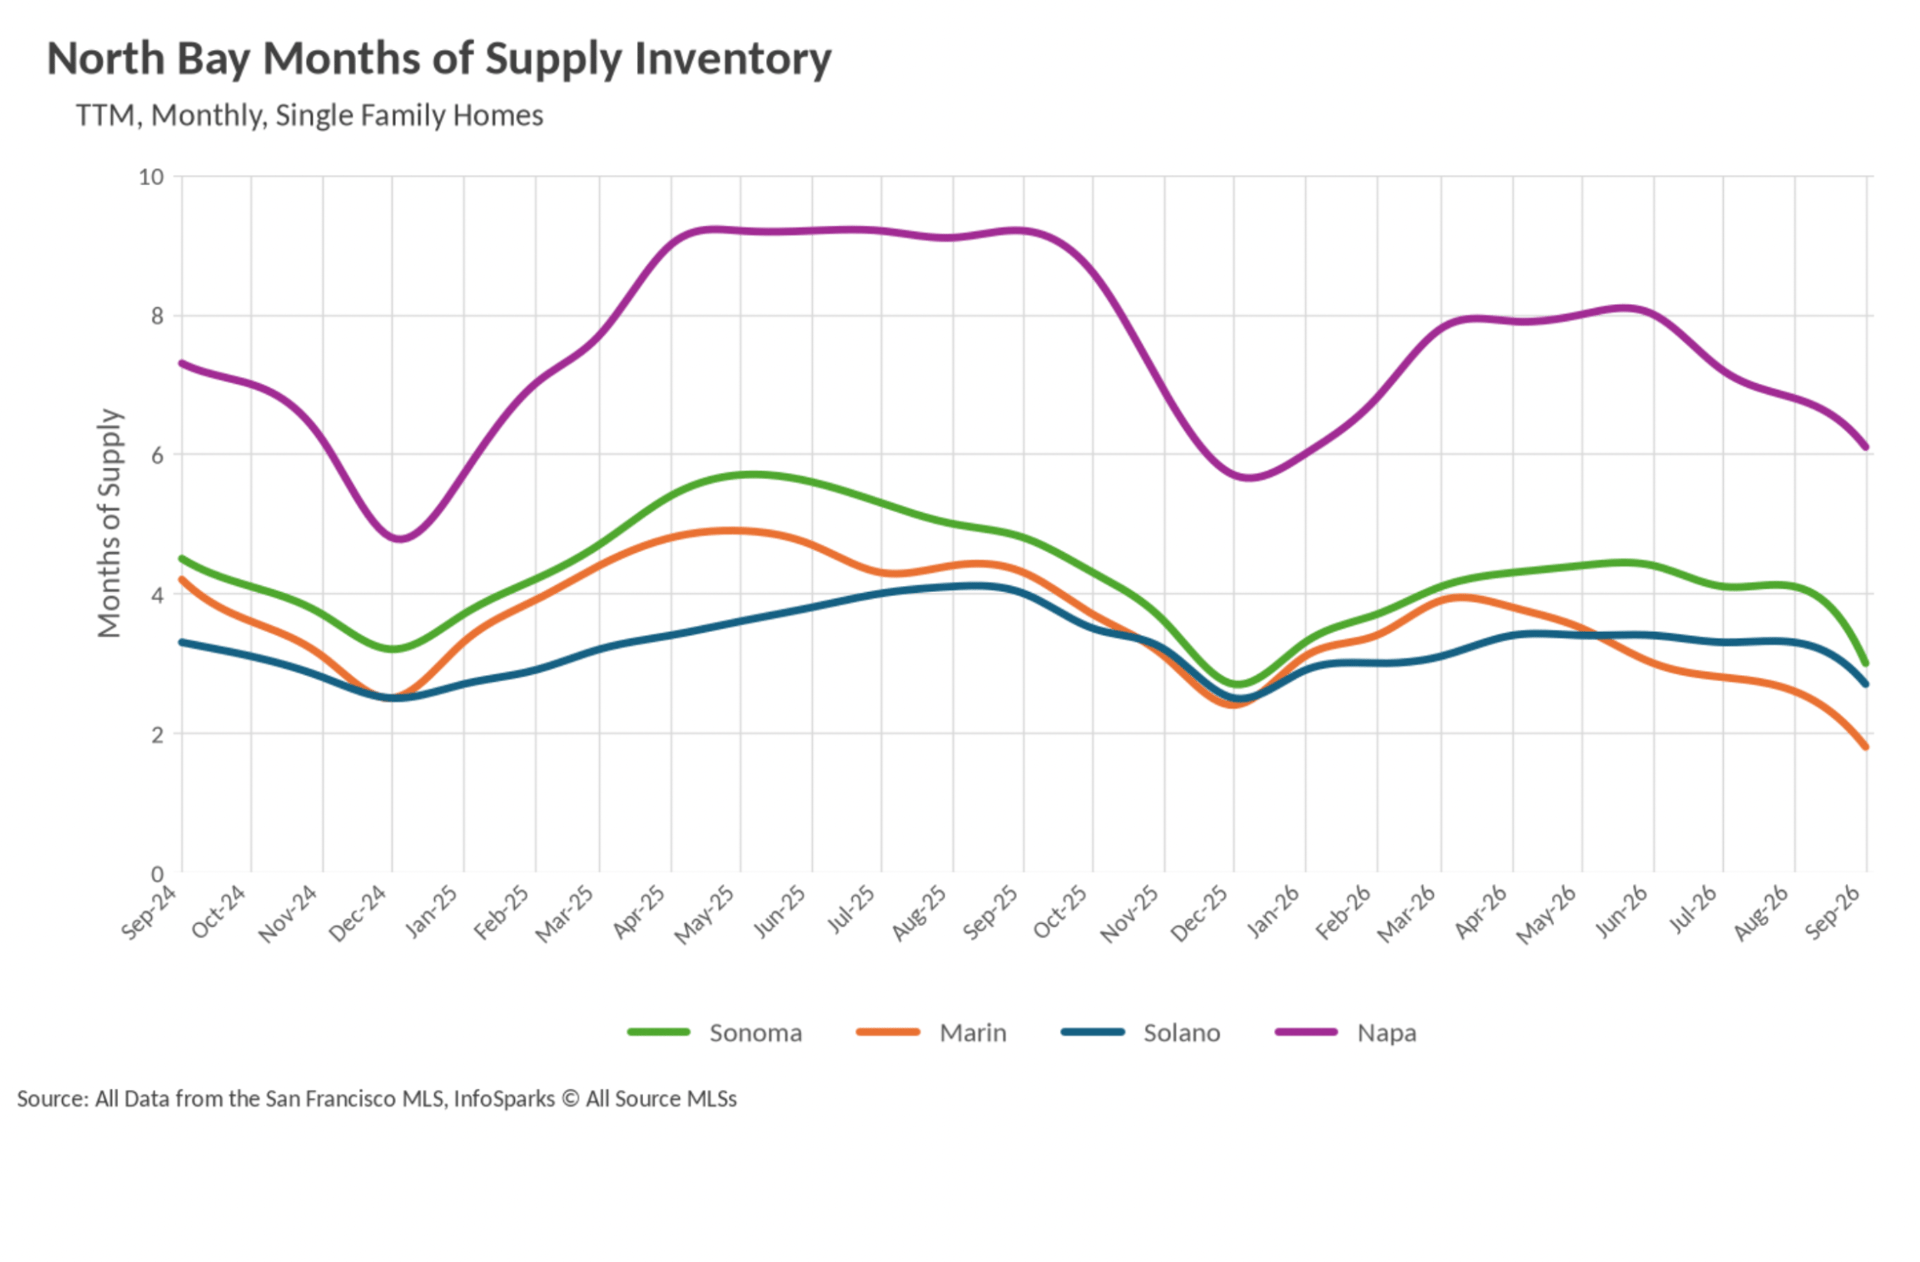
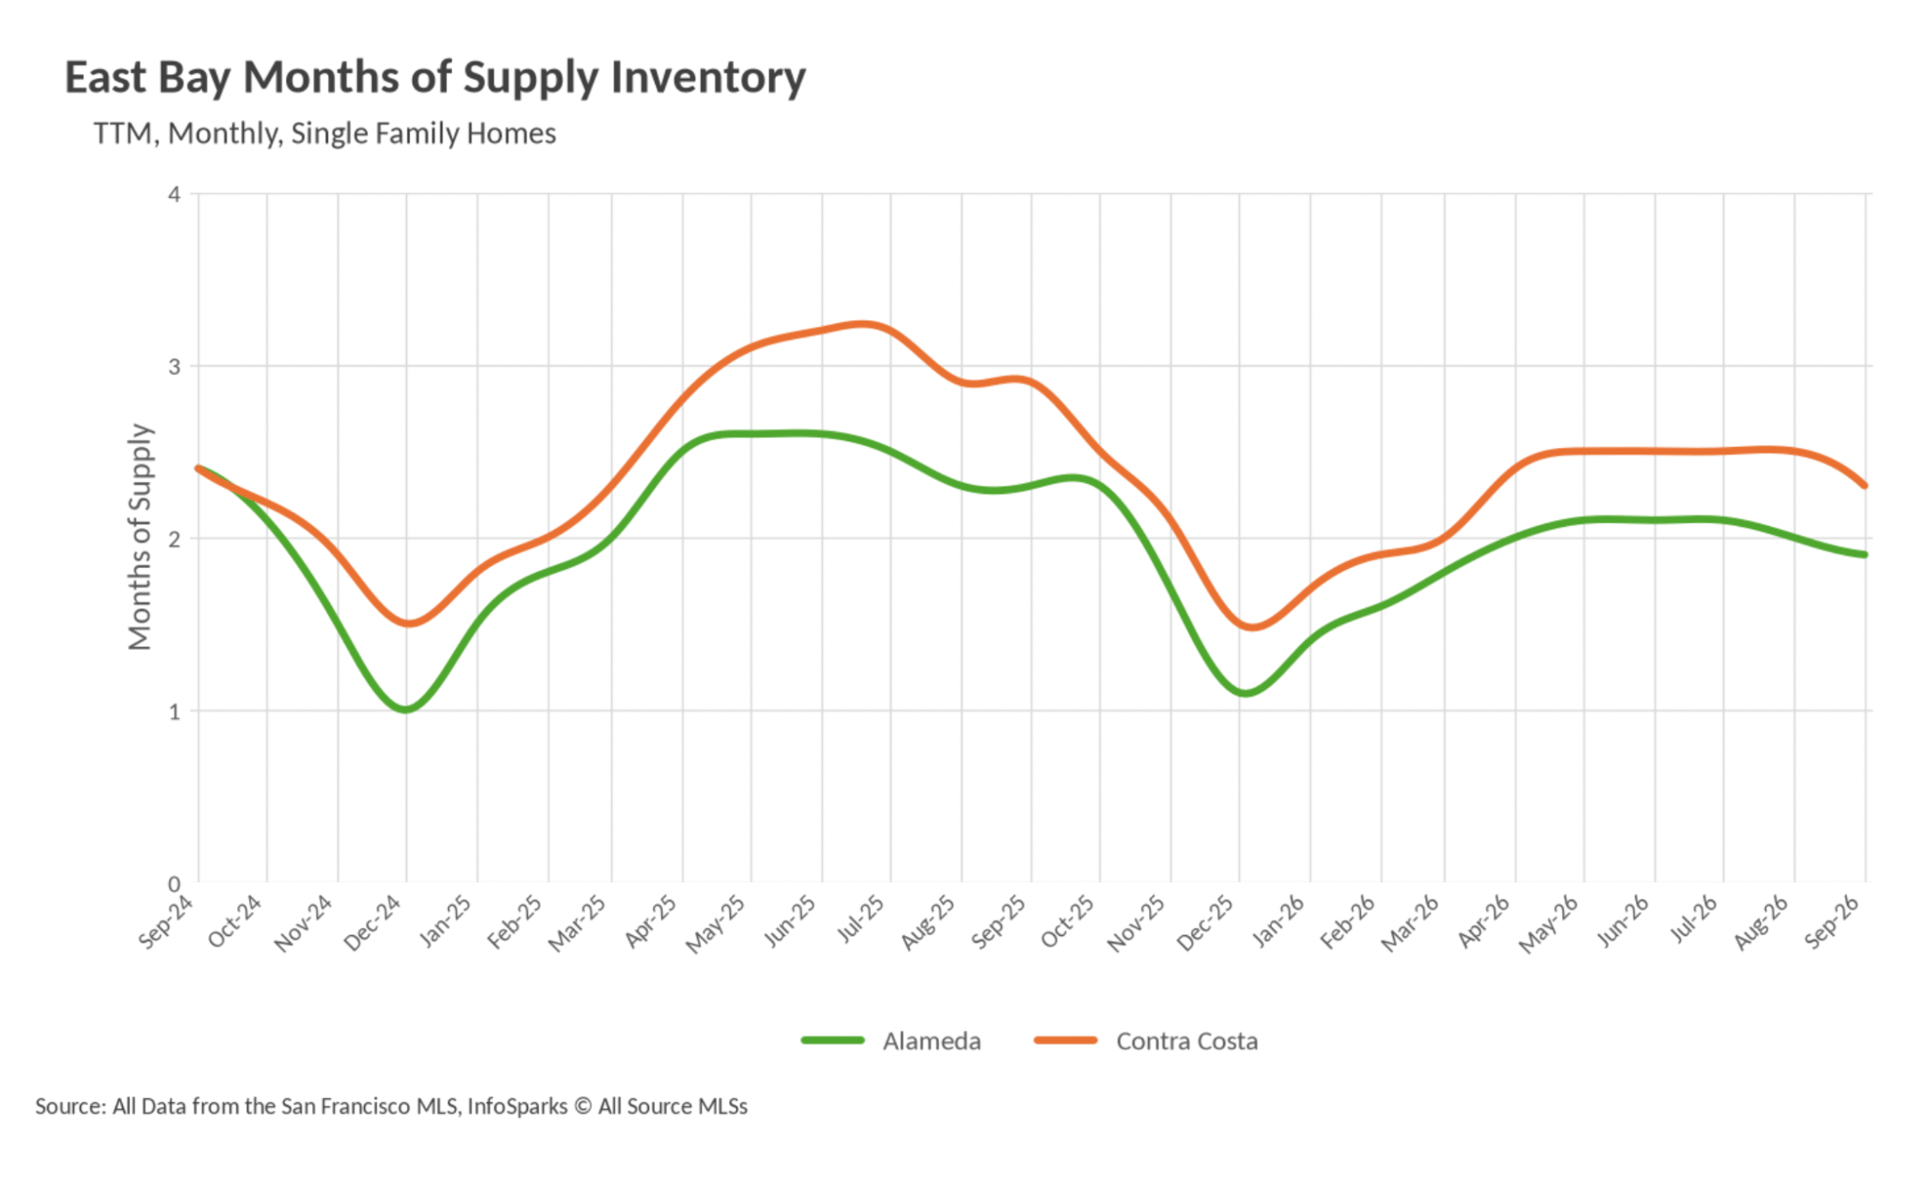
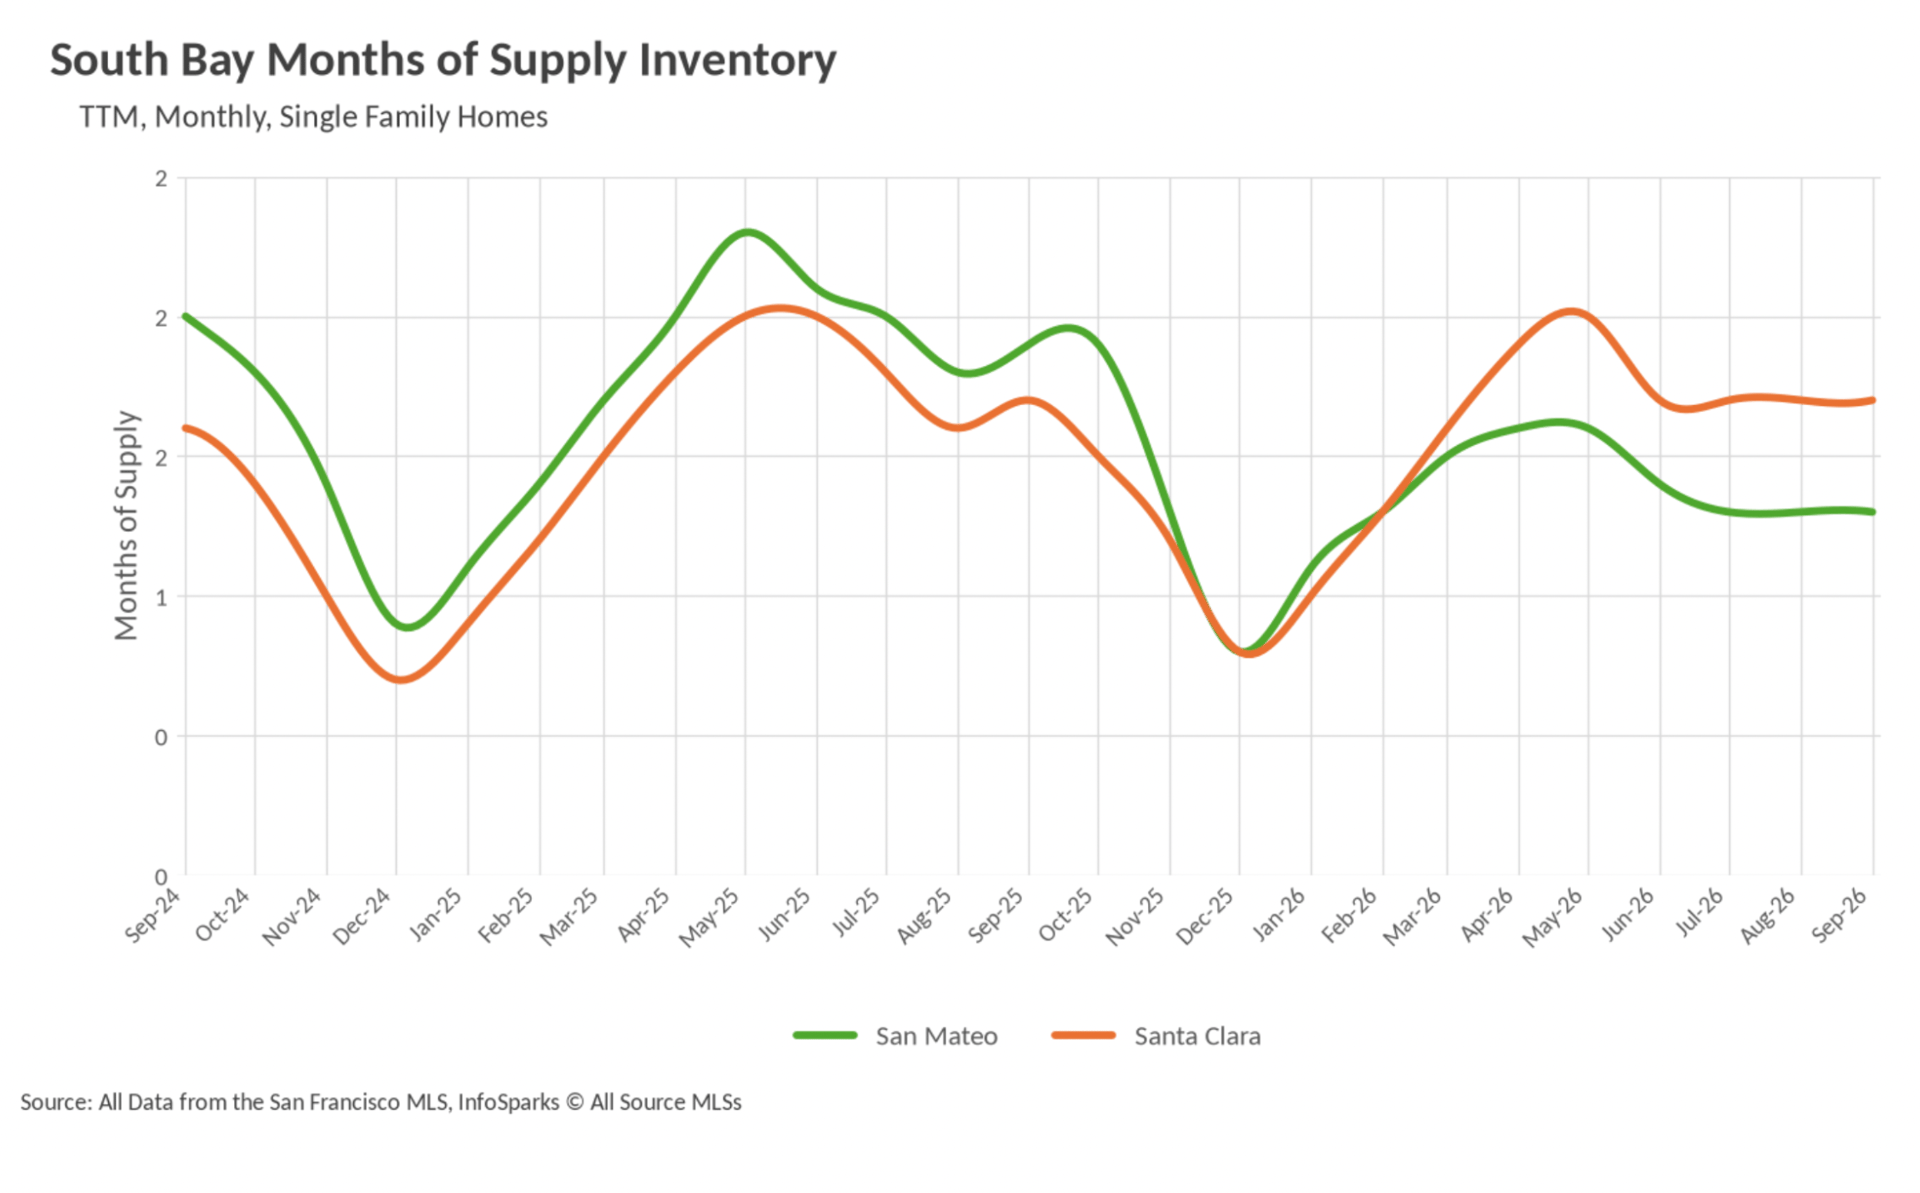
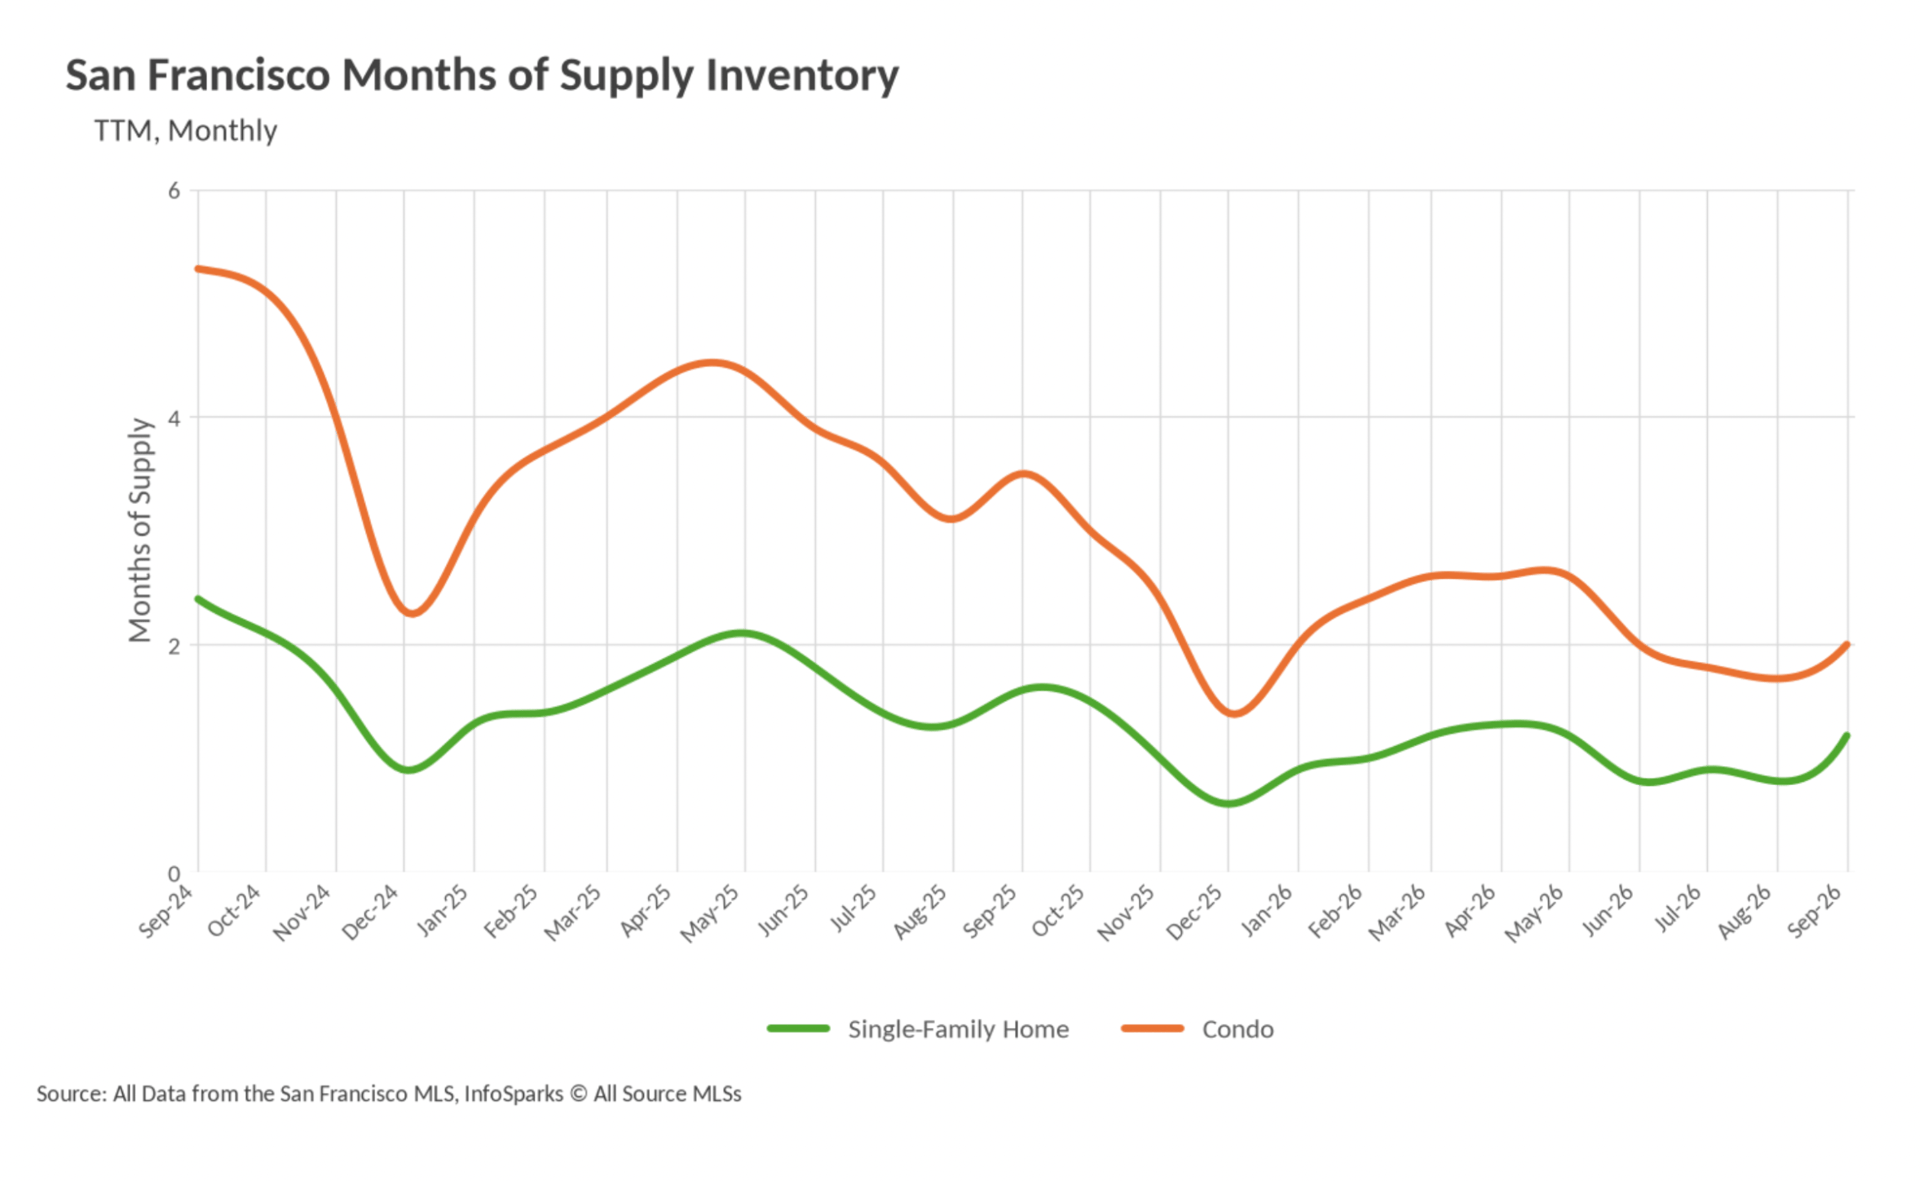
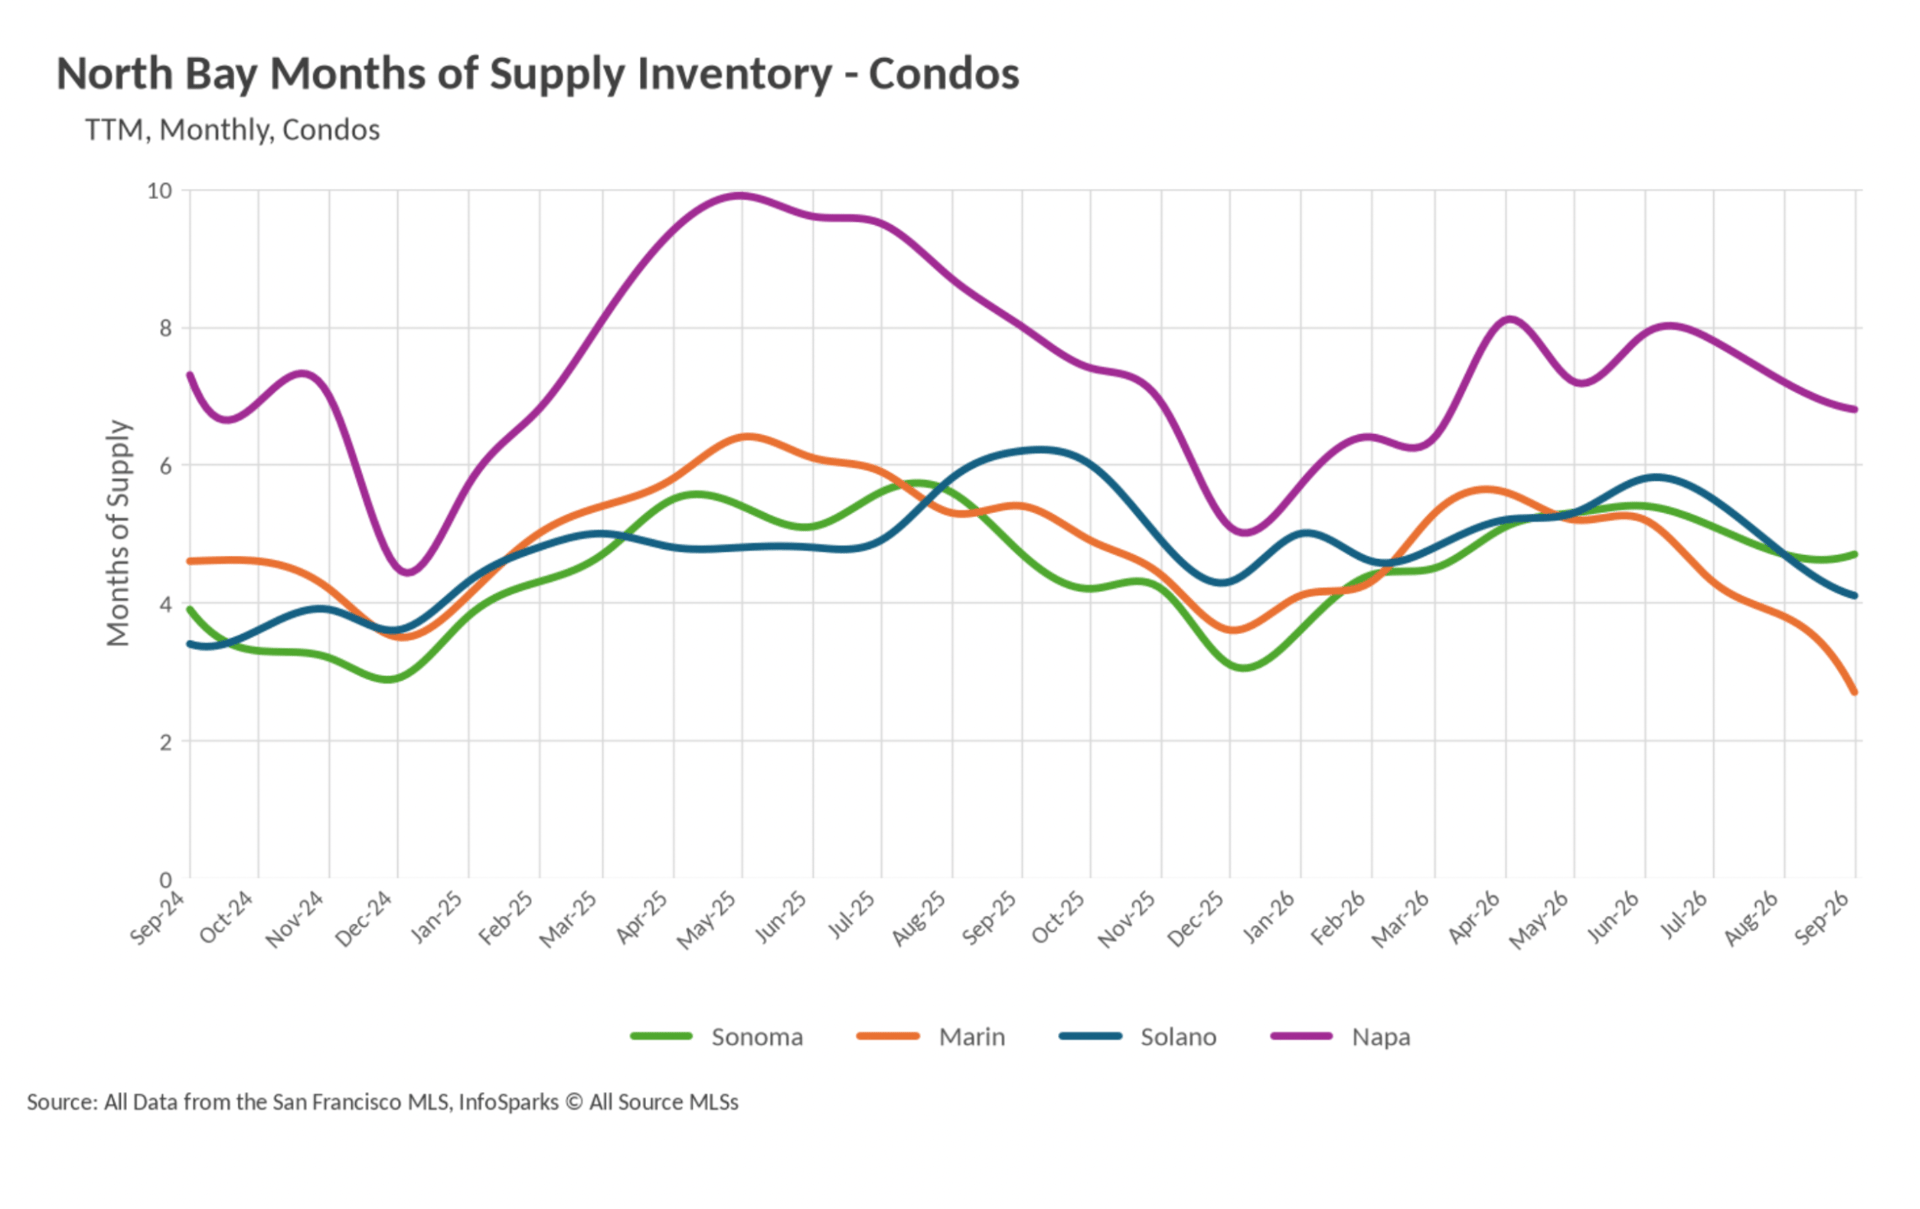
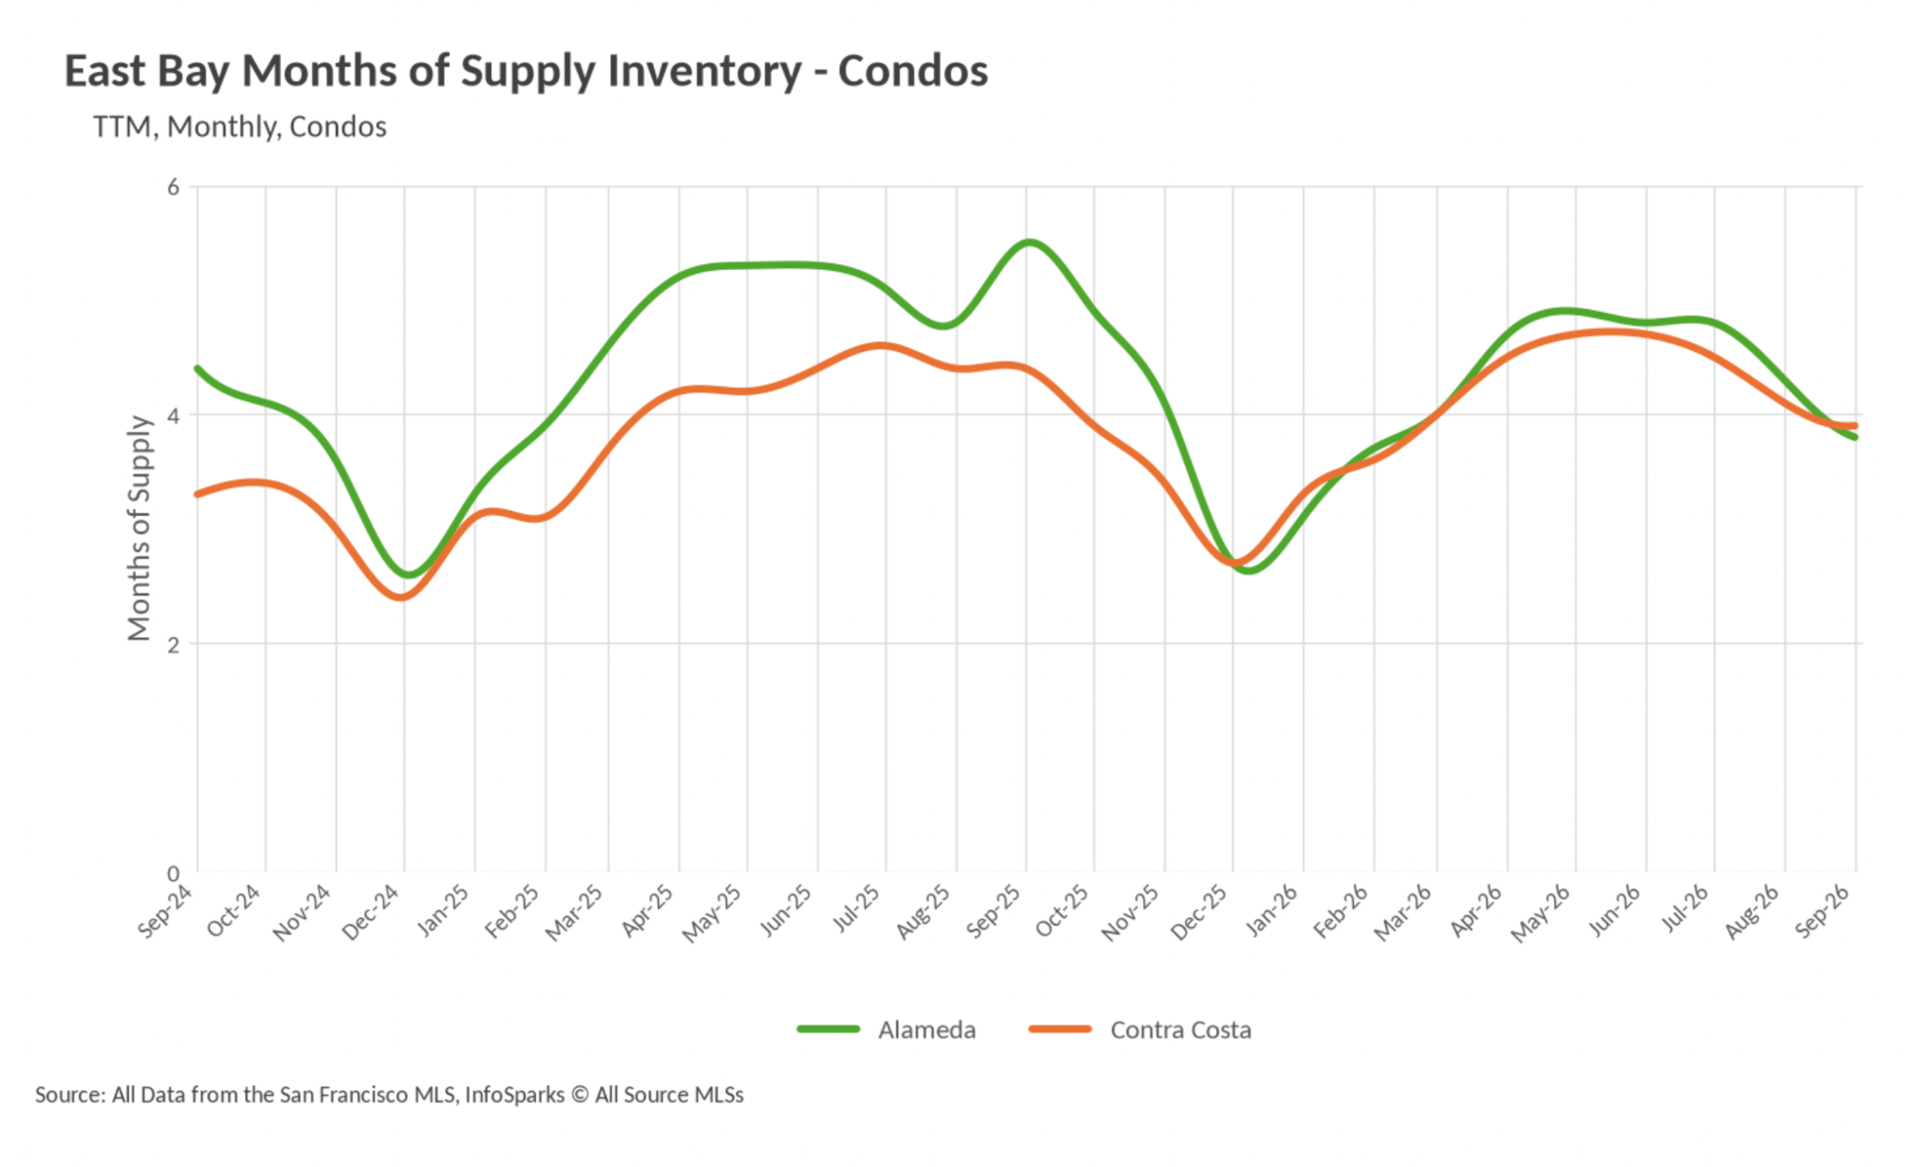
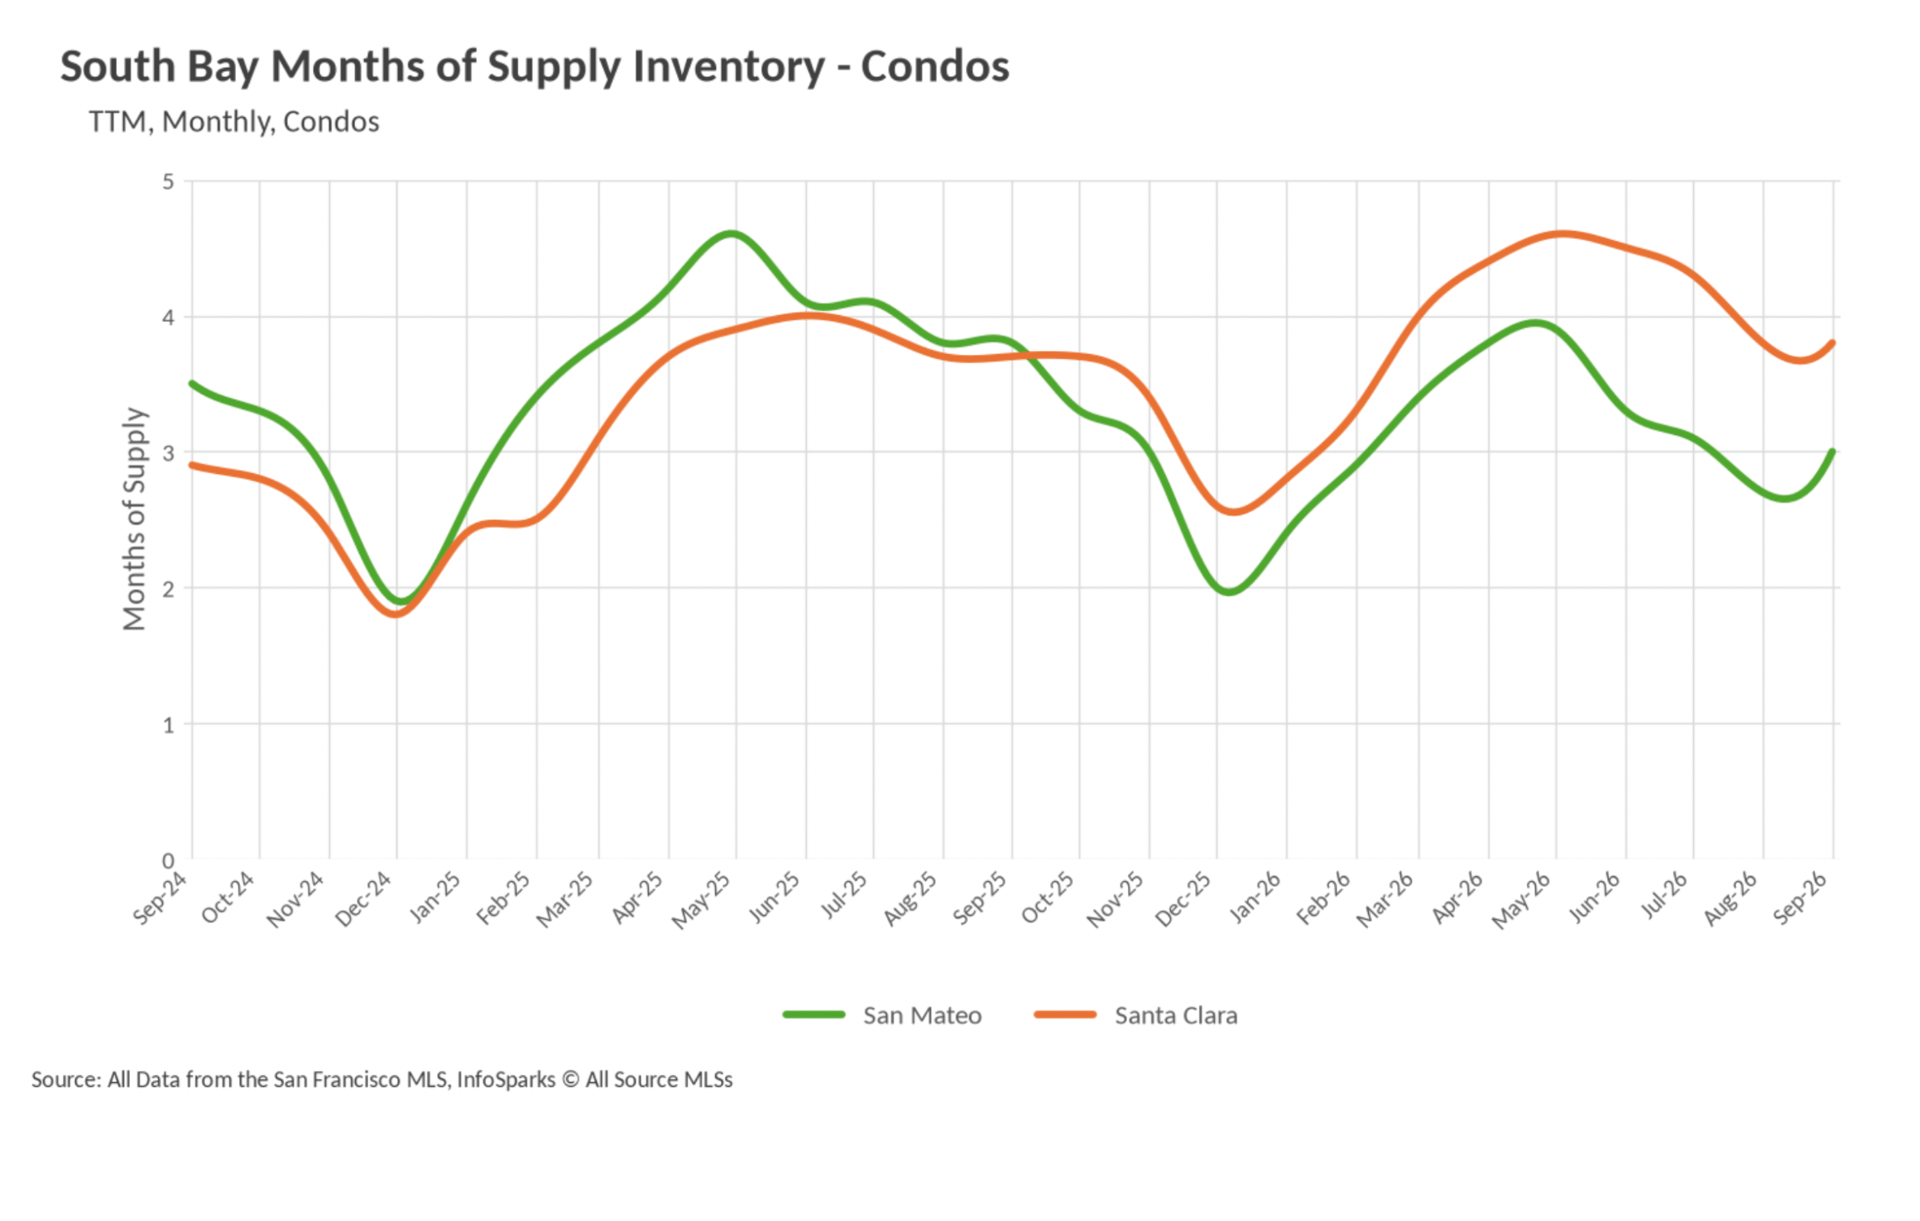
When determining whether a market is a buyers’ market or a sellers’ market, we look to the Months of Supply Inventory (MSI) metric. The state of California has historically averaged around three months of MSI, so any area with at or around three months of MSI is considered a balanced market. Any market that has lower than three months of MSI is considered a seller’s market, whereas markets with more than three months of MSI are considered buyers’ markets.
Measured that way, the region's single-family segment sits firmly in seller's territory this fall. San Francisco is tightest at 1.2 months, trailed by San Mateo County at 1.3 months, Santa Clara County at 1.7 months, Alameda County and Marin County at 2.0 months apiece, Contra Costa County at 2.3 months, and Solano County at 2.9 months. Marin's figure deserves attention, having fallen 53.49% from 4.3 months last September. Sonoma County has crossed into balance at 3.4 months, down from 4.8 months a year ago, Santa Cruz County registers 3.7 months, and Napa County stands as the region's only clear buyer's market at 6.4 months, although even that reading is 30.43% below last September's 9.2 months. Condos carry more slack but are trending the same way: San Francisco is at 2.0 months (down 42.86% year over year), San Mateo sits precisely at the 3.0 month equilibrium, and Marin is at 3.2 months, while Santa Clara (3.8), Alameda and Contra Costa (3.9 each), Santa Cruz (4.0), Solano (4.3), Sonoma (5.0), and Napa (7.2) continue to lean toward buyers. The practical implication for the closing stretch of 2026 is a two-speed market. Buyers chasing detached homes in San Francisco, Silicon Valley, the East Bay, or Marin need to be decisive, prepared for competition, and in San Francisco's case ready to go well beyond asking, where single-family homes closed at an average of 31% over original list price in September. Condo shoppers outside the urban core, by contrast, hold more leverage than they have had in years.

Thinking of buying or selling? Contact me today!
Stay up to date on the latest real estate trends.
November 7, 2026

October 22, 2026

October 9, 2026

October 9, 2026

October 2, 2026

September 11, 2026

September 3, 2026
August 14, 2026

August 14, 2026
You've got questions and we can't wait to answer them.